


What Is Technical Debt and Why It Has a Price
Every shortcut in the codebase is borrowed time.
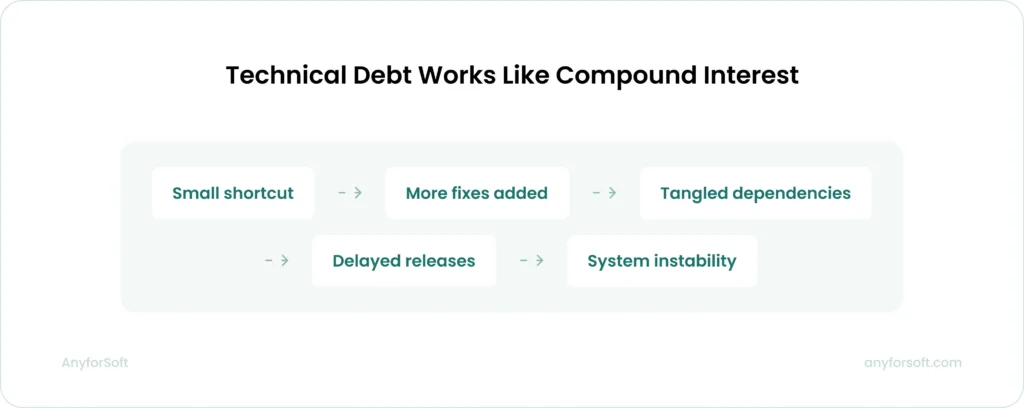
Ward Cunningham introduced the term in 1992 to describe what happens when code ships fast but isn’t built to last. The shortcut works today, but the cost of technical debt grows every day it stays in production. Interest on debt is the extra work every future change requires because of that shortcut. It builds up across sprints until it consumes engineering capacity.
The principal debt consists of:
- Deferred refactoring
- Missing test coverage
- Outdated dependencies
- Architectural decisions made under deadline pressure
Left unaddressed, each item generates technical debt cost in the form of maintenance overhead. Debugging cycles lengthen and onboarding slows down with every build.
The burden compounds before it registers as a budget line.
A codebase running on end-of-life dependencies needs security patches. Those patches block feature work. Blocked sprints delay releases, and delayed releases translate into missed revenue.
We remediated codebases in this condition for Imperial College Business School, projektmagazin, and Game Informer. That work, across 140+ engagements over 15 years, is where the patterns and figures in this article come from.
The True Cost of Technical Debt: Key Statistics
Unaddressed software quality issues show up in budget reports, sprint velocity, and release cadence across industries and company sizes.
Three independent research bodies have put figures to what engineering teams experience directly. Together, they make the business case for treating software quality as a measurable financial liability.
- $1.52 trillion — the accumulated repair backlog across US software systems, with the broader annual bill for poor software quality reaching $2.41 trillion. The figure includes operational failures, security incidents, and remediation costs across the software lifecycle.
- 20–40% — the share of the total technology estate that CIOs attribute to unaddressed engineering liabilities, before depreciation. On top of that, 10–20% of the IT budget earmarked for new products is redirected to paying it down. That is engineering spend diverted away from forward-looking work.
- 20% of IT budget — the average organizations dedicate to fixing software quality issues, based on a survey of US IT decision-makers. 30% report high or critical backlogs of unaddressed issues. The maintenance ratio at those organizations directly suppresses developer productivity and engineering velocity.
For a CTO, these figures open a specific opportunity.
When 20–40% of the technology estate consists of unaddressed issues, that share of the budget becomes available for reclaiming. It can shift from fixing cycles into feature development and infrastructure investment.
The McKinsey figure translates well into board-level conversations.
Once the backlog is quantified against the technology estate, it earns a place in financial planning. Organizations that measure their maintenance ratio first gain the clearest view of where that capacity is available.
Direct vs. Hidden Costs of Technical Debt
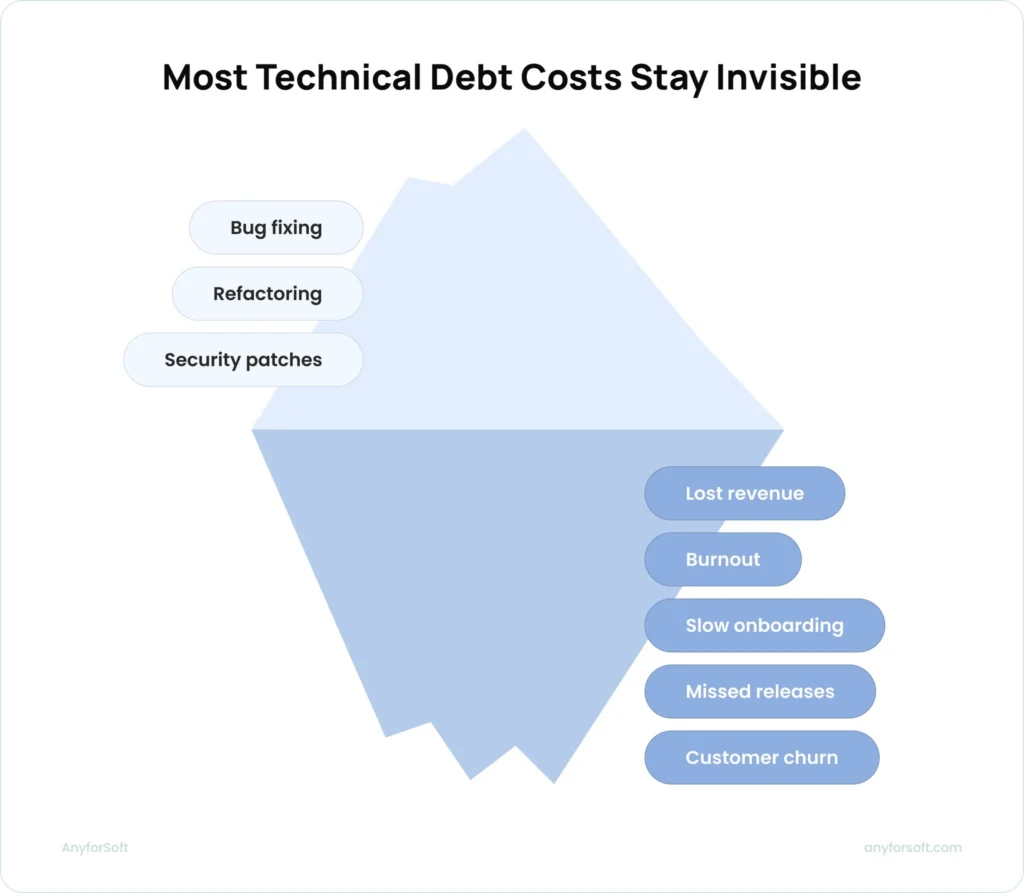
Unmanaged software quality generates expenses across four distinct areas. Some appear immediately in sprint reports and budgets. Others accumulate in revenue forecasts and attrition figures before anyone traces them back to engineering decisions made years earlier.
Direct Remediation And Refactoring Costs
Developer hours spent on refactoring carry a specific price. Rework cycles and extended sprints consume engineering capacity without advancing the product. Every sprint absorbed by fixes to legacy code is a sprint that ships nothing new. At scale, this is where the remediation cost first becomes visible on project timelines.
The Imperial College Business School engagement shows how quickly that scope expands. The platform presented layout glitches and a backlog of unresolved tasks. What looked like a contained bug-fix scope revealed architectural decay running deeper than the surface symptoms. The actual workstream covered security patches, structural fixes, Drupal 9 updates, and a Drupal 10 migration pathway scoped from scratch.
Time-to-repair on a system in that condition is rarely what the initial assessment suggests. What looks like a two-week fix becomes a multi-month engagement.
This gap between the expected and actual scope is where direct expenses accumulate fastest.
Opportunity Costs
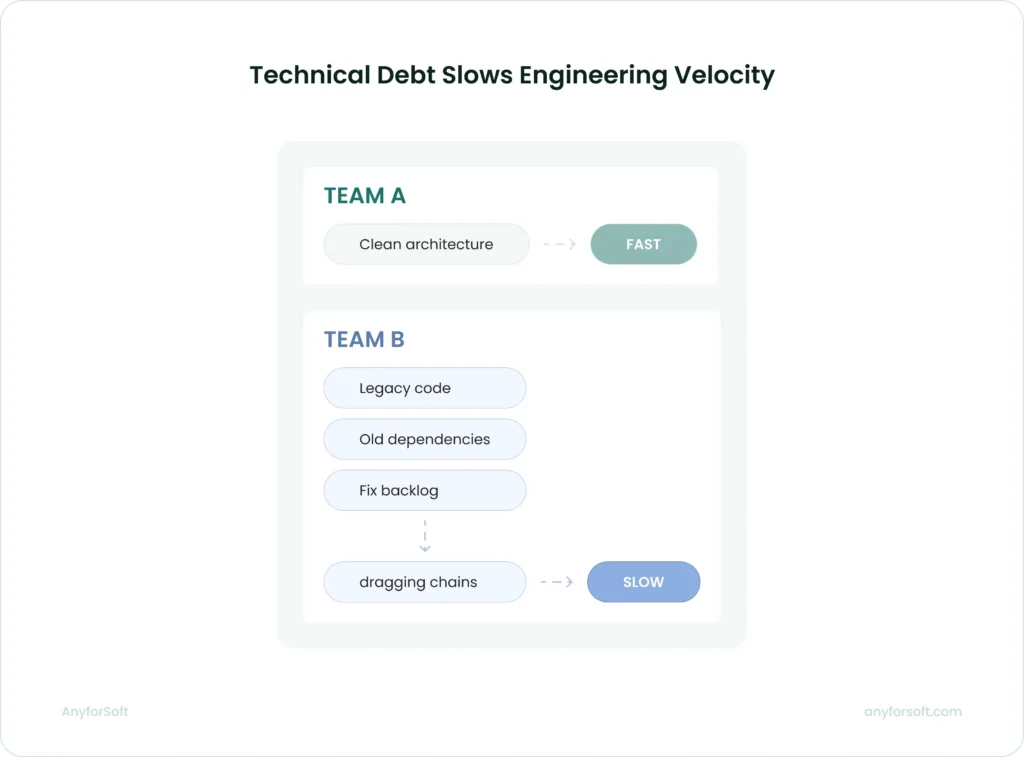
Technical debt business impact extends beyond remediation cost. Unaddressed software quality issues slow engineering velocity before they cause visible failure.
By the time a system breaks, the opportunity cost has been accumulating for quarters.
The pattern is consistent:
- DELAYED FEATURES. Development teams navigate around constrained architecture instead of building forward
- Slower TIME-TO-MARKET. Each release carries the overhead of working through structural limitations that compound with every sprint
- Missed revenue windows. Competitors ship while engineering capacity is absorbed by repair overhead
- Declining RELEASE CADENCE. The interval between deployments lengthens as the codebase becomes harder to change safely
The technical debt business impact is not only what engineering spends fixing code. It is what the business fails to earn while navigating constraints that should have been addressed.
A feature delayed by one quarter affects revenue, market position, and customer retention simultaneously. This compounding effect is what makes the revenue impact the hardest item to quantify. It is also the most important one to communicate to leadership.
Hidden Business Costs
The hidden cost of technical debt that appears least often in engineering reports is staff turnover cost. Software entropy is the gradual degradation of a system’s structure and maintainability. It erodes developer productivity as the software ages and becomes harder to work with.
Engineers working daily against brittle systems and unresolved issues accumulate frustration at a measurable rate.
The connection between code quality and attrition is direct. A Stepsize survey of 200+ engineers found that 51% had left or considered leaving a company specifically because of codebase quality levels.
Replacing a senior developer costs between $30K and $150K when recruitment, onboarding, and knowledge transfer are factored in.
That figure compounds when attrition clusters.
Teams carrying the heaviest remediation backlogs tend to lose their most experienced engineers first. Losing senior engineers is the most expensive exit pattern and leaves the deepest gap in institutional knowledge.
Each one increases the burden on those who remain, which accelerates the next.
Infrastructure and Security Costs
Legacy code running on end-of-life runtimes and unpatched dependencies generates security vulnerabilities at a rate that outpaces manual oversight. In regulated industries, that exposure adds compliance risk on top of operational risk. Architectural decay at the infrastructure layer is slower to surface than sprint-level friction — and more expensive to resolve when it does.
projektmagazin, the largest German-language project management portal with 100K+ monthly visitors and 25K subscribers, was running Drupal 6 when it reached end-of-life in February 2016. Three years of accumulated security vulnerabilities passed before migration was addressed. By that point the site carried 13,000+ nodes across 13 content types — a scope that required full IT consulting engagement rather than a contained upgrade.
The post-migration outcomes were measurable: 31% speed increase, 18% traffic growth, and 10% subscriber growth.
The code coverage and structural work completed during migration produced gains that three years of deferred action had made impossible beforehand.
How To Calculate Technical Debt
Identifying exposure categories is the first step.
Quantifying them is what turns technical debt from an engineering concern into a budget conversation. The methods below give CTOs and engineering leads the tools to produce numbers their finance and leadership teams can act on
The SQALE Method and Technical Debt Ratio
The title stands for Software Quality Assessment based on Lifecycle Expectations. It measures the work required to bring a codebase up to a defined quality standard.
SonarQube implements it automatically. The platform scans software systems for quality issues and calculates a technical debt ratio by dividing estimated repair time by total development time.
This ratio is the foundation of most estimation programs in enterprise engineering teams today.
The benchmarks give the ratio practical meaning:
- A ratio under 5% indicates a healthy system with manageable maintenance overhead.
- Above 20%, the software presents systemic risk. Structural issues are broad enough to affect delivery across the team.
Most engineering teams land between 10% and 25% on their first audit. That range is where intervention produces measurable improvement in code quality score and sprint capacity.
A tech debt register built from SonarQube output gives teams a prioritised list of issues to address. It separates issues by severity, module, and estimated fix time. That structure converts a ratio into an actionable workplan with prioritised steps.
Cost Per Line Of Code
The $3.61 per line of code benchmark gives teams a starting figure for budget conversations at the system level.
Applied to total line count, it produces a first-order estimate of codebase exposure. Applied module by module, it identifies where debt cost per line of code concentrates.
This is where effort delivers the highest return.
Cyclomatic complexity measures how many independent paths run through a piece of code. Code smell density measures how frequently structural patterns that signal poor maintainability appear. Both affect how accurately the benchmark applies.
A module with high branching logic carries a heavier fixing burden than the flat figure suggests. Poor test coverage pushes it further above the $3.61 figure. Tools like NDepend and Coverity surface these variations before the estimate hardens into a budget line.
The benchmark is a starting point for the budget conversation.
The final number requires adjustment for the specific software in question.
Treating it as a precise figure without that adjustment produces estimates that understate what the work will actually require.
Architecture age, test coverage gaps, and dependency complexity all affect the real number. Its value is in opening the conversation with leadership. The procurement decision requires a more detailed assessment.
Time-Based Estimation
This type of estimation converts a backlog into a budget line.
Each item in the technical debt backlog gets an estimated repair time, multiplied by the team’s hourly rate. The output is a prioritised list with a dollar figure attached that engineering and finance teams can read together.
Jira and GitHub support this through tagging workflows built into the tools engineers already use. As issues are identified, they are labelled and routed into the tech debt register incrementally, sprint by sprint, without a separate audit process. How to estimate technical debt this way requires no additional tooling.
Time-to-repair estimates improve with each cycle. Early audits tend to understate maintenance overhead on modules with undocumented dependencies.
Successive cycles calibrate the model against actual data. That calibration tightens figures from a rough estimate into a number the business can plan around.
Business Value at Risk Model
This model answers a question finance teams actually ask:
What revenue is at risk if this codebase work is deferred another quarter?
Blocked features are mapped to estimated business value. A delivery timeline probability weighting is then applied. The output connects engineering backlog directly to projected revenue impact.
For a CFO or board audience, that framing matters. Engineering spend figures read as overhead until they are attached to a revenue consequence.This reframing shifts the conversation.
It positions software investment as protection of future earnings, not a response to past decisions.
TCO and ROI figures built from this model give leadership two levers.
- TCO frames the full lifecycle cost of carrying unaddressed issues.
- ROI frames what resolution releases.
The innovation budget moves from fixing cycles into new product work. The debt interest rate drops, and delivery capacity becomes available for forward-looking work.
AI Tools For Quantifying Technical Debt Costs
Manual audits surface issues. AI-assisted code analysis surfaces them faster and ranks them by business impact. This gap between identification and action shrinks from weeks to days.
AI-Powered Code Analysis And Automated Cost Estimation
CodeScene AI combines behavioral analysis with static scanning. However, the distinction from conventional tools runs deeper than methodology.
Static analysis captures how code looks at a single point in time. Behavioral analysis tracks change patterns. A module revised under deadline pressure by rotating engineers carries risk no static scan would surface.
A module with an acceptable static quality score can still carry the highest structural risk in the system if its change history shows sustained fragility under deadline conditions.
SonarQube measures what exists today. CodeScene AI measures trajectory. Together they produce a prioritisation picture that neither tool generates alone.
LLM-assisted refactoring compresses the audit cycle further. Intelligent SQALE scoring runs automatically. Weeks of manual analysis become days.
AI Turns Technical Debt Detection Into Continuous Forecasting
Ml-Driven Risk Scoring And Business Impact Prediction
Reactive prioritisation is a guess. A well-trained ML model is not.
Models built on incident data and deployment patterns rank issues by probable business impact.
It means the items most likely to generate the highest remediation overhead surface before they cause failure, not after.
This single shift changes how engineering budgets get allocated. It shortens the argument for protecting sprint capacity and accelerates engineering velocity recovery after release.
Release cadence is where the improvement becomes visible first. AI debt detection removes the triage guesswork that consumes the opening days of every sprint. Teams stop reconstructing what broke and start addressing what the model flags as next in line.
Automated Forecasting and Trend Tracking
A point-in-time audit produces a snapshot. A CI/CD-integrated detection workflow produces a living register.
Code Climate is a code quality platform that monitors maintainability and test coverage continuously. Dependabot tracks dependency vulnerabilities and flags outdated packages as they appear. Both run inside the CI/CD pipeline. New issues are caught at the point they are introduced.
Trend tracking adds the dimension that snapshots miss. The relevant question is whether the remediation pace is outrunning the accumulation rate, or falling behind it. A tech debt register updated continuously makes that comparison visible in real time.
Automated cost estimation built on trend data reduces budget surprises.
When accumulation consistently outpaces addressing work, the spend trajectory becomes visible quarters before it becomes a crisis.
This early visibility shifts the conversation from reactive engineering requests to planned investment cycles.
Technical Debt Cost By Industry And Company Size
Remediation exposure concentrates in specific industries and compounds at specific team sizes. Understanding where your organisation sits in that picture is what makes benchmarking actionable.
Four industry contexts show the most distinct patterns:
- Fintech. The highest maintenance ratio of any sector sits in core banking systems built on COBOL or early Java. Deferring that work is expensive. Addressing it incorrectly carries operational risk proportional to the criticality of the systems involved.
- Healthcare. Regulatory change consistently outpaces engineering capacity. Integration and compliance obligations accumulate as architectural decay. the root cause is a structural gap between what the regulatory environment demands and what the codebase can absorb.
- Media and enterprise SaaS. Architectural decisions made at 50K users were correct for that scale. At 5M users, those same decisions become the primary constraint on legacy system modernization. Software entropy accelerates at this inflection point.
- All sectors: Smaller organisations and larger ones face different levels of fixing exposure. Smaller organisations carry proportionally higher structural exposure per developer than larger ones with dedicated platform teams.
Team size introduces a separate dynamic. Small teams manage codebase complexity through shared context. Every engineer knows which modules are fragile and why. Scaling past 20–30 engineers breaks that. Institutional knowledge disperses faster than documentation captures it. The TCO of carrying unaddressed issues forward rises sharply at this threshold. As it does, the maintenance ratio consumes an increasing share of engineering spend. For teams navigating this transition, how to scale a software product covers the architectural considerations in more depth.
How To Reduce The Cost Of Technical Debt
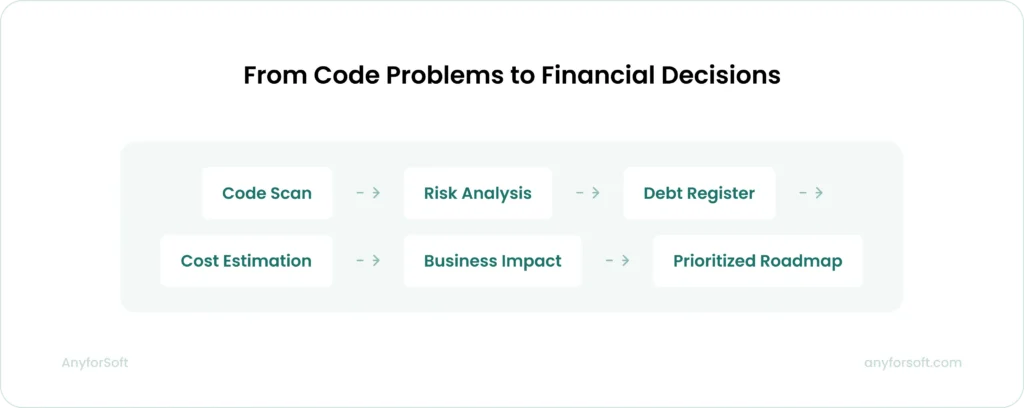
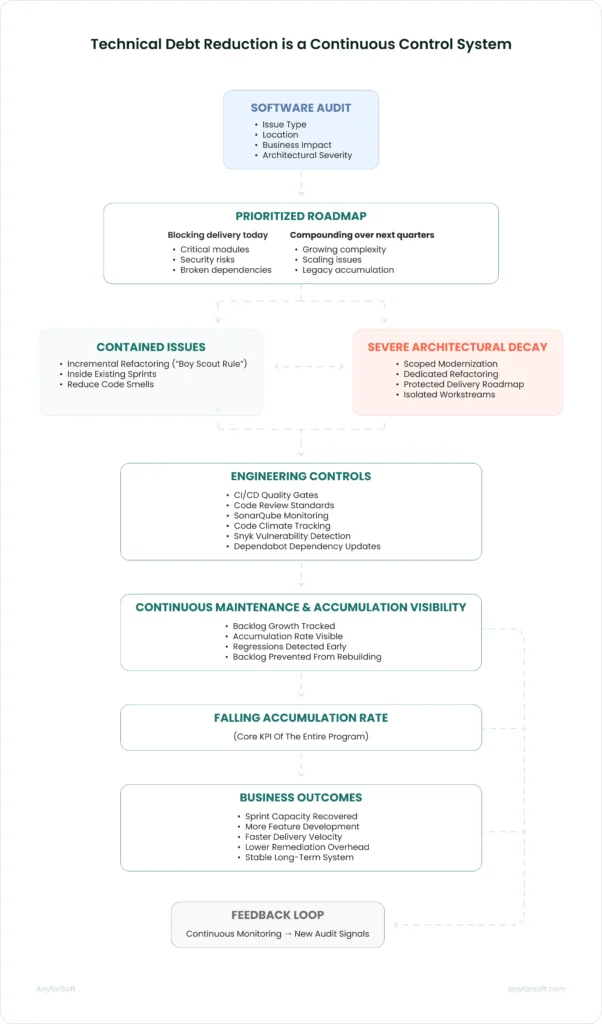
A software audit maps the codebase by issue type, location, and business impact before any budget is committed. Without that map, efforts address symptoms rather than root causes — and the backlog rebuilds. SonarQube and Code Climate produce the initial scan; a structured tech health check translates the output into a prioritised roadmap that separates what is blocking delivery today from what will compound quietly over the next two quarters.
This prioritisation logic is the foundation of any effective technical debt reduction program.
Two refactoring approaches apply. For contained issues, the Boy Scout Rule runs inside existing sprints. Engineers improve the code surrounding any module they touch, reducing code smell density incrementally without pulling capacity from feature work.
Severe architectural decay requires a different response.
Scoped sprints isolate the effort and protect the delivery roadmap. The workstream gets the focused capacity it needs to close properly.
This threshold, when incremental refactoring gives way to a full legacy application modernization program, depends on architectural severity and delivery risk.
Engineering practice improvements reduce the accumulation rate while the team works through the existing backlog.
The following tools and practices form the operational foundation:
- CI/CD pipeline integration: automated quality gates at each commit prevent new code smell from entering the system undetected.
- Code review standards: structured review criteria enforce code coverage thresholds and flag complexity before it merges
- SonarQube: continuous static analysis tracks the maintenance ratio across the full software estate and surfaces regressions between sprints.
- Code Climate: monitors maintainability trends and test coverage over time
- Snyk: identifies security vulnerabilities in dependencies before they become compliance exposure
- Dependabot: automates dependency updates, reducing the accumulation of outdated packages that generate remediation overhead
Ongoing software maintenance and support keeps accumulation rates visible between audit cycles and prevents the backlog from rebuilding once the work is done.
The goal is a managed, visible trend with a falling accumulation rate.
Technical debt ROI does not come from reaching zero issues; no engineering organisation operates there. It comes from reducing the burden to the point where it stops competing with feature development for sprint capacity.
Each sprint reclaimed from fixing overhead is a sprint available for product work. This is where cost avoidance compounds into a measurable return.
Teams that have brought their software to a managed, stable state are better positioned to make proactive IT infrastructure investment decisions rather than reactive ones.
Getting the approach right is half the work. The other half is having done it before — across enough systems, in enough states of decay, to know where the surprises tend to hide.
Reducing Technical Debt Requires Continuous Control, Not One-Time Fixes
Why Teams Choose AnyforSoft To Address Technical Debt Costs
We have worked with systems at every stage of structural deterioration across 15 years and 140+ engagements in fintech, EdTech, media, and healthcare. In several cases, every engineer who built the original system had already left the organisation.
The proof is in the outcomes we achieved.
Software Audit And Tech Health Check
Every engagement opens with a full system scan.
Our engineers run a full system scan and produce a tech debt register with three data points per item: estimated repair time, cost rate mapping, and a business impact score. The output gives clients a prioritised, finance-readable view of their engineering exposure before any fixing work begins.
The software assessment covers the full system, including architecture, dependencies, test coverage, and security posture. Every part of the system is assessed, regardless of assumed risk level.
The clients receive a complete picture of where the financial exposure sits, ranked by the order in which addressing it produces the highest return.
AI-First Engineering Approach
Static scanning identifies what exists in the system today. It does not surface how the system is changing — which modules are accumulating fragility under delivery pressure, and which are stable despite surface-level issues. That gap is where the highest-risk items hide.
CodeScene AI’s behavioral analysis identifies risk patterns that static scanning misses. SonarQube tracks the maintenance ratio and surfaces regressions between sprints.
LLM-assisted refactoring accelerates the fixing work, compressing what would otherwise be weeks of manual analysis into days.
The automated cost estimation output gives clients a continuously updated view of their engineering exposure as the engagement progresses.
Legacy System Modernization Experience
The hardest legacy system modernization engagements have one thing in common: the engineers who built the system are no longer there.
The system is running and the integrations are live. The documentation reflects decisions no one on the current team remembers making.
This is the condition under which architectural decay is hardest to reverse and most expensive to leave unaddressed.
Game Informer presented exactly this challenge. The gaming publication with a 28-year history was being revived in 2025. We inherited a system rated 8 out of 10 for complexity by our internal standards. No user data existed. No institutional knowledge of the original architecture remained.
Multiple integrations needed to function correctly from day one. Revenue systems had zero tolerance for failure at relaunch.
The outcomes were measurable.
The platform rebuilt 26,000 subscribers from zero. The relaunch handled 5 million concurrent visitors. Uptime held at 100% through the traffic spike. Technical debt ROI in an engagement of this complexity is not only what the fixing work costs — it is what a failed relaunch would have cost instead.
Transparent Tech Debt Register And Prioritisation
Clients receive a business-impact-ordered roadmap from the first audit output. Every item in the technical debt backlog is ranked across three dimensions: fixing overhead, business risk, and velocity impact. This ranking determines the sequence. Items with the highest return come first. Those carrying the highest risk are flagged for immediate attention, whatever the fixing overhead.
The register updates continuously as the engagement progresses. Cost avoidance compounds as items are addressed in priority order. Each high-impact fix releases engineering capacity that would otherwise have been absorbed by the downstream consequences of leaving it unaddressed.
The ROI of the sequencing is visible in sprint velocity within the first two cycles.
Flexible Engagement Models
Organisations arrive at different points — some need a clear picture first, others need hands-on help immediately.
Three engagement models cover this range:
- Audit and roadmap. Full system scan, tech debt register, prioritised fixing plan, and cost rate mapping. They are delivered as a standalone output the client’s team executes against.
- Embedded engineering. Our engineers work inside the client’s existing team, addressing register items within the client’s sprint structure and software product development workflow.
- Full remediation ownership. AFS takes end-to-end responsibility for the fixing program, with defined milestones, progress reporting, and handover criteria agreed at the start of the engagement.
The right model depends on internal capacity, timeline pressure, and how much of the institutional knowledge of the system still exists inside the team.
FAQs
What is the cost of technical debt and how does it accumulate?
Every deferred engineering decision carries a financial consequence.
Every shortcut taken under deadline pressure adds to the principal debt. That principal generates interest on debt in the form of maintenance overhead. Debugging cycles lengthen and onboarding slows with every project.
Accumulation follows a compounding pattern. Small items deferred across multiple sprints interact with each other, making future changes harder than the individual items would suggest. A system that receives no structured attention typically reaches systemic risk territory within two to three years, depending on development pace and team size.
How much does the hidden cost of technical debt globally?
The scale is measured in trillions. Independent research from CISQ, McKinsey, and Forrester consistently shows that accumulated software quality issues represent 20–40% of the total technology estate value at most organisations.
Between 10–20% of the budget nominally dedicated to new products is redirected to addressing existing issues.
The global figure is difficult to pin down precisely because methodology varies across research bodies. What the data shows consistently is that the maintenance ratio consumes a material share of most engineering budgets, and the trend is upward.
What Are The Hidden Costs Of Technical Debt That Businesses Overlook?
Four categories consistently go undetected. Developer attrition: poor software quality is a leading reason engineers leave, and replacing a senior engineer runs between $30K and $150K.
- Missed revenue. Delayed features and slower release cadence are rarely connected to software quality in revenue forecasts.
- Security exposure. Security exposure: unpatched dependencies accumulate compliance risk that surfaces as incident spend.
- Opportunity cost. The most expensive hidden item is what the organisation failed to build while engineering capacity was absorbed by fixing work.
Making these visible requires connecting software quality data to financial planning. A structured software audit and tech debt register make that connection possible.
How Do You Calculate Technical Debt In Your System?
Three methods apply in combination.
The SQALE method, implemented through SonarQube, calculates a technical debt ratio by dividing estimated repair time by total development time. it produces a percentage that maps directly to benchmark thresholds.
The $3.61 per line of code benchmark gives teams a starting figure for budget conversations. Applied module by module, it identifies where fixing effort delivers the highest return.
Cyclomatic complexity and code smell density affect how accurately the benchmark applies to any specific system.
Time-based estimation adds the third layer. Each item in the technical debt backlog is mapped to an estimated repair time and multiplied by the team’s hourly rate. The output is a prioritised list that gives engineering and finance teams a shared financial reference point.
What Is The Technical Debt Ratio And What Is A Healthy Target?
The technical debt ratio expresses how much of the development investment is effectively owed back in fixing work. SonarQube calculates it by dividing estimated repair time by total development time.
Four benchmark thresholds define the risk landscape:
- Under 5%: healthy, fixing overhead fits inside normal sprint cycles.
- 5–10%: issues present but contained, incremental refactoring is sufficient.
- 10–20%: structural attention needed, maintenance ratio is high enough to suppress engineering velocity.
- Above 20%: systemic risk, scoped fixing programs are required.
Most engineering teams land between 10% and 25% on their first structured audit. That range is where intervention produces the clearest improvement in sprint capacity.
How Does Technical Debt Affect Developer Productivity And Team Velocity?
The impact on engineering teams operates on two timescales.
- The immediate impact is measurable in hours: research consistently shows engineers spend close to one full working day per week on fixing work rather than new development.
- The longer-term impact is structural. Software entropy degrades maintainability over time.
Each new feature takes longer to build. Release cadence lengthens and deployment confidence falls. Developer productivity recovers when fixing work is addressed in priority order — the goal is reducing the maintenance ratio to the point where it stops competing with feature development for sprint capacity.
Which Industries Face The Highest Cost Of Tech Debt?
Fintech carries the highest maintenance ratio. Core banking systems built on COBOL or early Java represent decades of deferred legacy system modernization. The fixing risk is proportional to the criticality of the systems involved.
Healthcare accumulates software entropy through compliance obligations that consistently outpace engineering capacity. Media platforms and enterprise SaaS companies face a growth-phase inflection point — architectural decisions correct at 50K users become the primary constraint at 5M. Smaller organisations across all sectors carry proportionally higher fixing exposure per developer than larger ones with dedicated platform teams.
How Long Does It Typically Take To Pay Down Technical Debt? (Technical Debt ROI)
The timeline depends on three variables: the current technical debt ratio, the severity of architectural decay in the highest-risk modules, and the capacity allocated to fixing work.
Contained issues addressed through incremental refactoring within existing sprints show measurable returns within two to three sprint cycles.
Full legacy system modernization programs typically require six to eighteen months before the ratio reaches a manageable level. The more useful question is when the return becomes visible — in structured engagements, the first measurable improvement in engineering velocity appears within the first two sprint cycles of prioritised fixing work.
How Can AI Help Estimate And Quantify The Cost Of Technical Debt?
AI changes two things about software quality estimation: speed and depth. AI-assisted code analysis compresses the audit cycle from weeks to days. Automated cost estimation produces a continuously updated view of repair exposure as the system changes.
Static analysis measures what exists today. AI behavioral analysis measures how the system is changing — which modules accumulate fragility under delivery pressure and which carry structural risk on static scan surfaces. CodeScene AI ranks issues by probable financial impact, which means the highest-risk items surface before they cause failure.
What AI-Powered Tools Are Used To Detect, Measure, And Reduce Technical Debt Costs?
The tool landscape is divided by function. For detection: CodeScene AI combines behavioral analysis with static scanning. SonarQube tracks the maintenance ratio continuously. Code Climate monitors maintainability trends and test coverage inside the development workflow.
For measurement: NDepend and Coverity produce detailed cyclomatic complexity analysis that calibrates budget estimates to the specific system. For reduction: Dependabot automates dependency updates. Snyk identifies vulnerabilities before they become compliance incidents. LLM-assisted refactoring compresses manual analysis cycles and generates fixing candidates for engineers to review and implement.
The most effective configurations combine a behavioral analysis platform with a static analysis tool and an automated dependency management layer.