

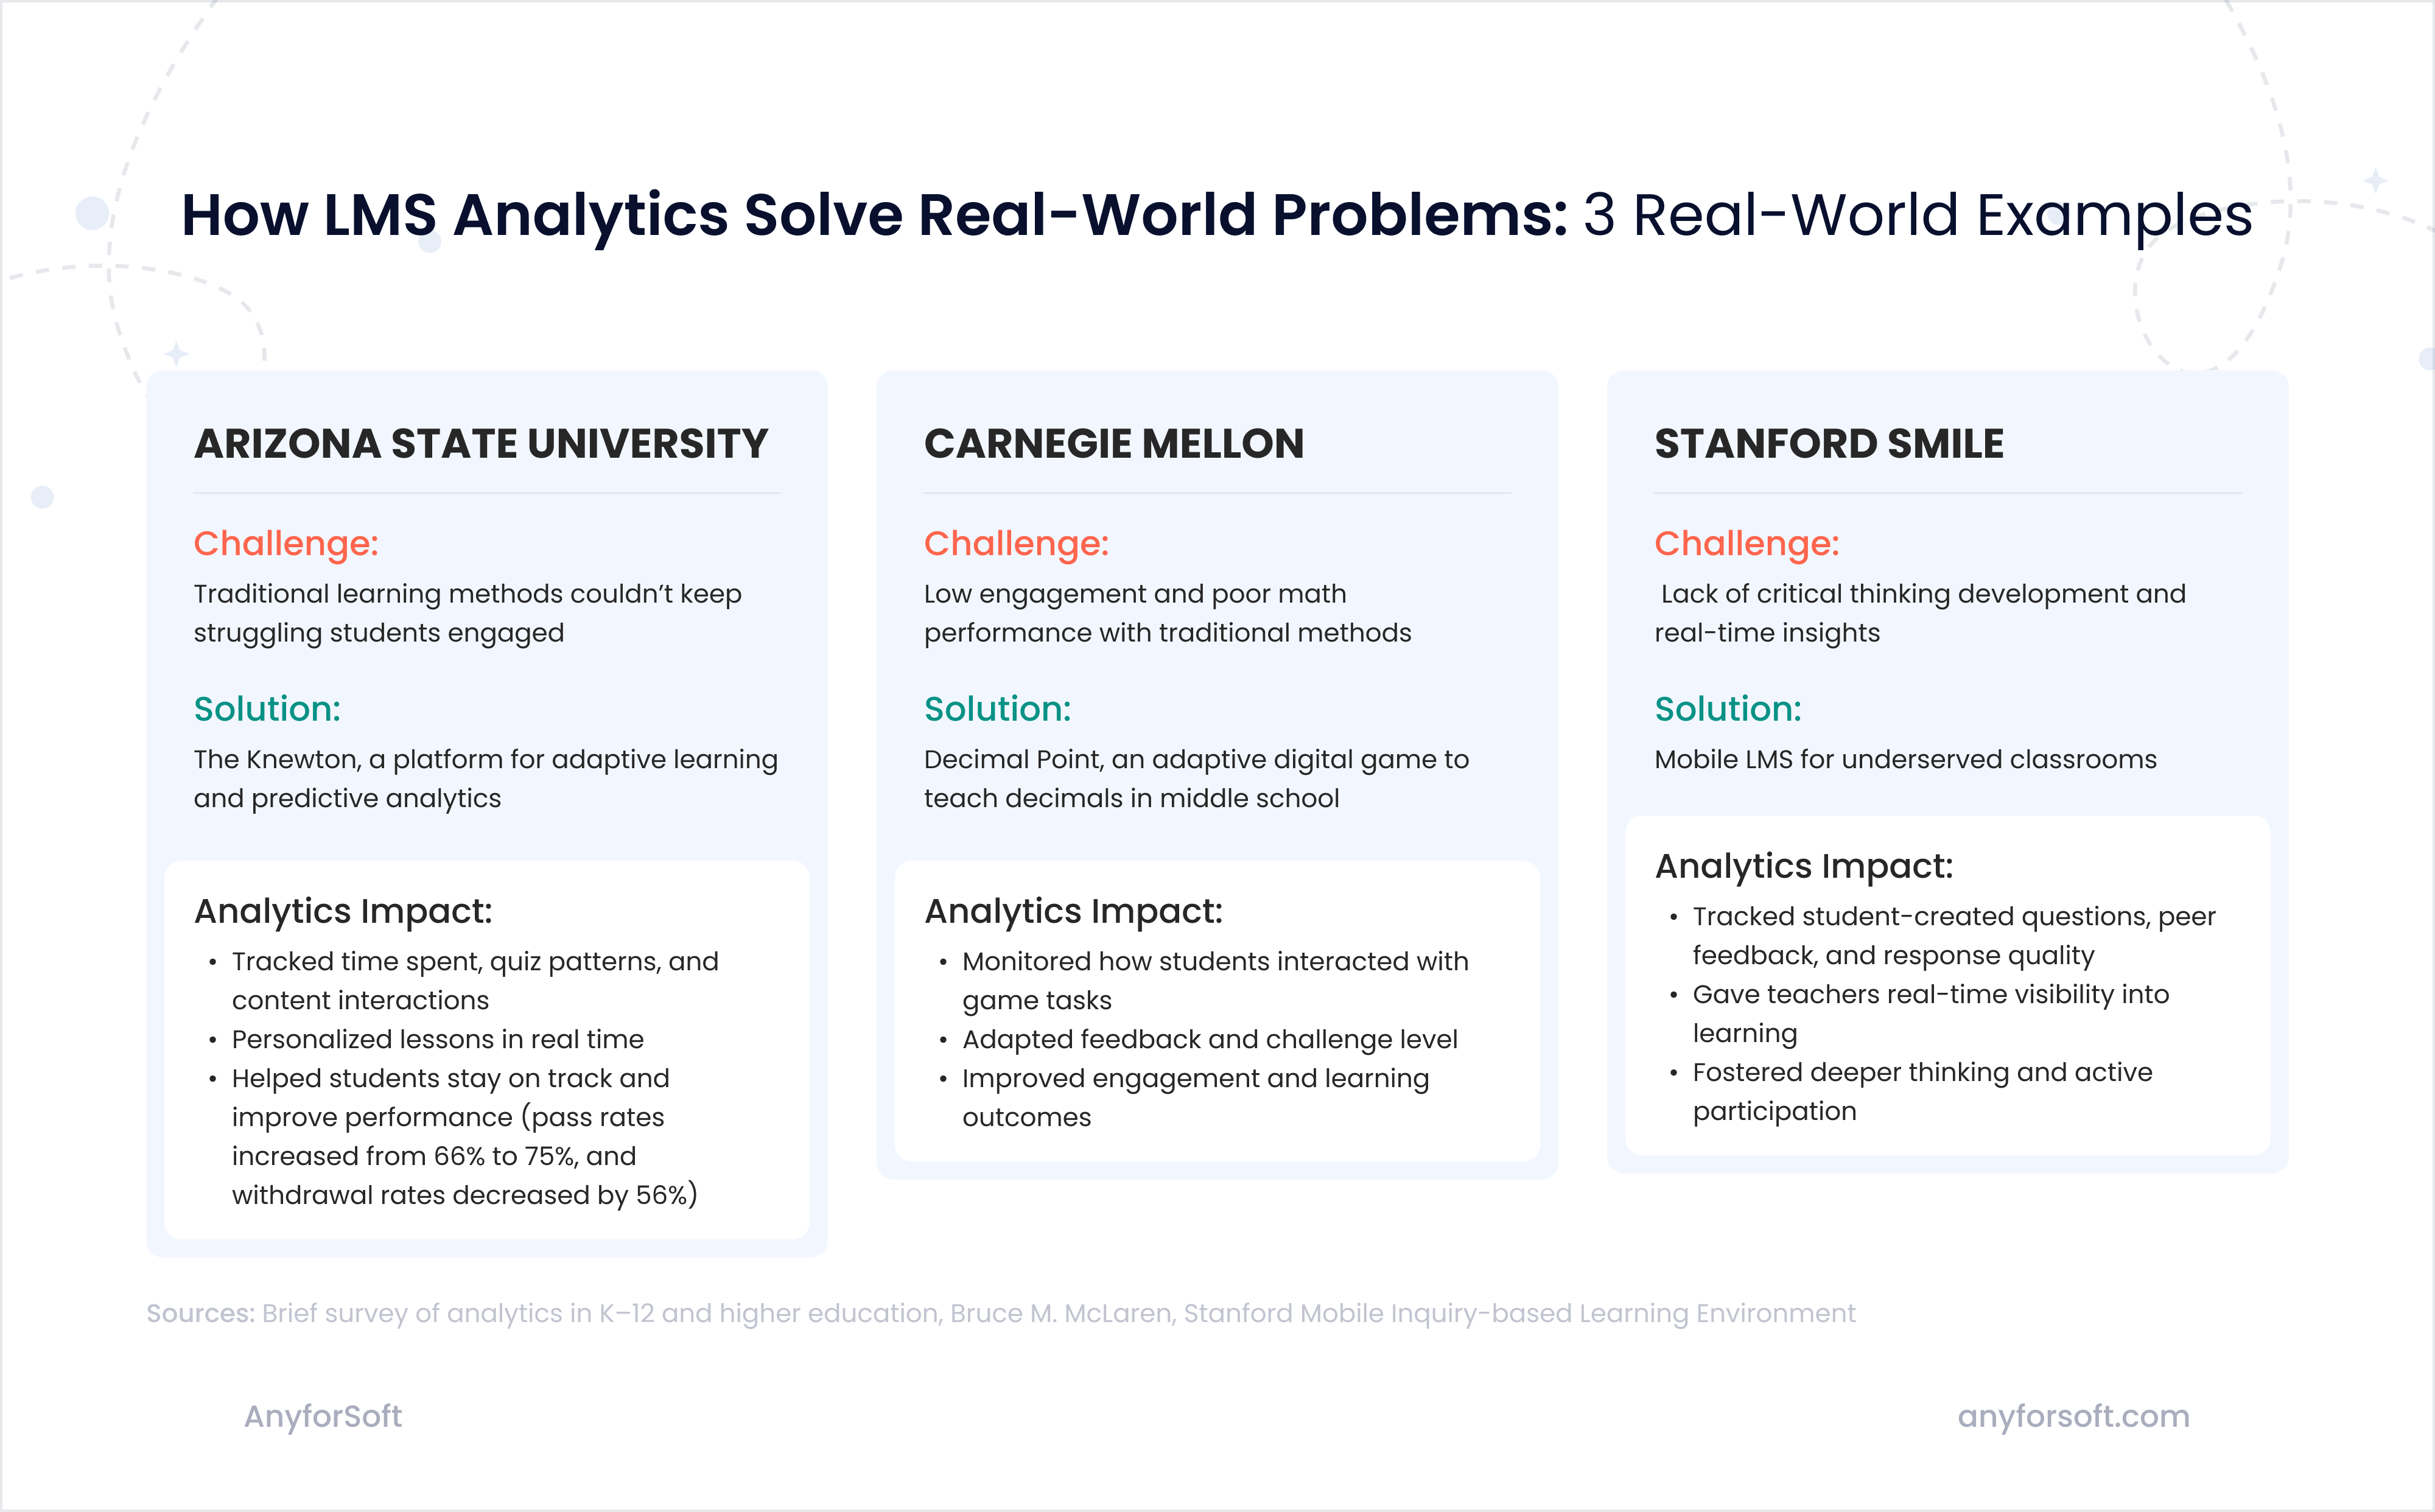
Analytics in an LMS is powerful. To show how impactful it can be, let’s start with three real-world examples.
While the examples below aren’t recent or based on traditional LMS platforms alone, they were conducted by leading institutions and remain highly influential.
Each case highlights how analytics—when thoughtfully integrated into a learning environment—can dramatically improve outcomes in training programs and online training settings.
Sources:
- Brief survey of analytics in K–12 and higher education
- Bruce M. McLaren
- Stanford Mobile Inquiry-based Learning Environment
So yes – learning management system analytics is powerful. But it can also be ambiguous, and this ambiguity lies in the fact that implementing analytics tools isn’t like choosing presents for your dearest friends: the more, the better. Quite the opposite.
Each block of features requires a respectable budget, not to mention time, if you need data analytics to optimize your LMS improvement.
- Which metrics do you need?
- Which are mandatory, and which are desirable?
The answers lie in two dimensions:
- The stage of your learning platform life. Some analytics metrics you need right at the start, while others can be added as soon as your project scales up.
- The industry. A feature like time-on-task, which measures how much time learners spend on specific tasks or assessments, is essential in formal education, where it helps identify learning bottlenecks and support knowledge retention. However, in fast-paced business environments, where speed and completion are the main priorities, this metric may offer less practical value, especially in large-scale online training initiatives.
In this article, we’ll explore both. The blog post body is focused more on the differentiation between basic and extended analytical features and the need for them at different stages of MLS development.
If your interest lies in choosing the right features for a specific industry, don’t miss the strategic checklist you’ll find at the end of this blog post.
Why We Distinguish Basic and Advanced LMS Metrics
As mentioned in the introduction, this differentiation is crucial—it helps you focus on features that truly add value to the learning process.
So, we won’t go in circles explaining why this distinction matters.
It helps to reduce two types of risks:
- Skipping essential features can leave you flying blind.
- Implementing advanced ones too early can waste time, inflate costs, and deliver zero value.
The two hypothetical scenarios below will allow us to look at both sides of the equation.
Scenario 1. Engagement Data Overlooked in a Compliance Training
A company provides mandatory compliance training programs and tracks only course completion. On paper, everything looks fine—employees completed the modules and passed the quizzes. However, a later audit reveals that many learners spent under two minutes on hour-long modules.
Without time-on-task tracking, the company missed signs of low engagement.
Since the quizzes were short and easily passed without studying the material, the training program met legal requirements but failed to ensure knowledge retention—and the company missed an opportunity to strengthen its risk management.
Scenario 2. Predictive LMS Analytics Implemented Too Early
An organization launches a new LMS with a user base of fewer than 100 learners. Eager to boost retention, the team decides to implement predictive learning management system analytics to flag users at risk of disengaging.
However, the available data is too limited and inconsistent to train a reliable model. As a result, the system produces inaccurate alerts—some highly engaged users are flagged incorrectly, while truly disengaged learners are missed.
Managers lose trust in the reports, developers backtrack to troubleshoot the logic, and the feature drains resources without delivering actionable value, slowing down the effectiveness of their online training strategy.
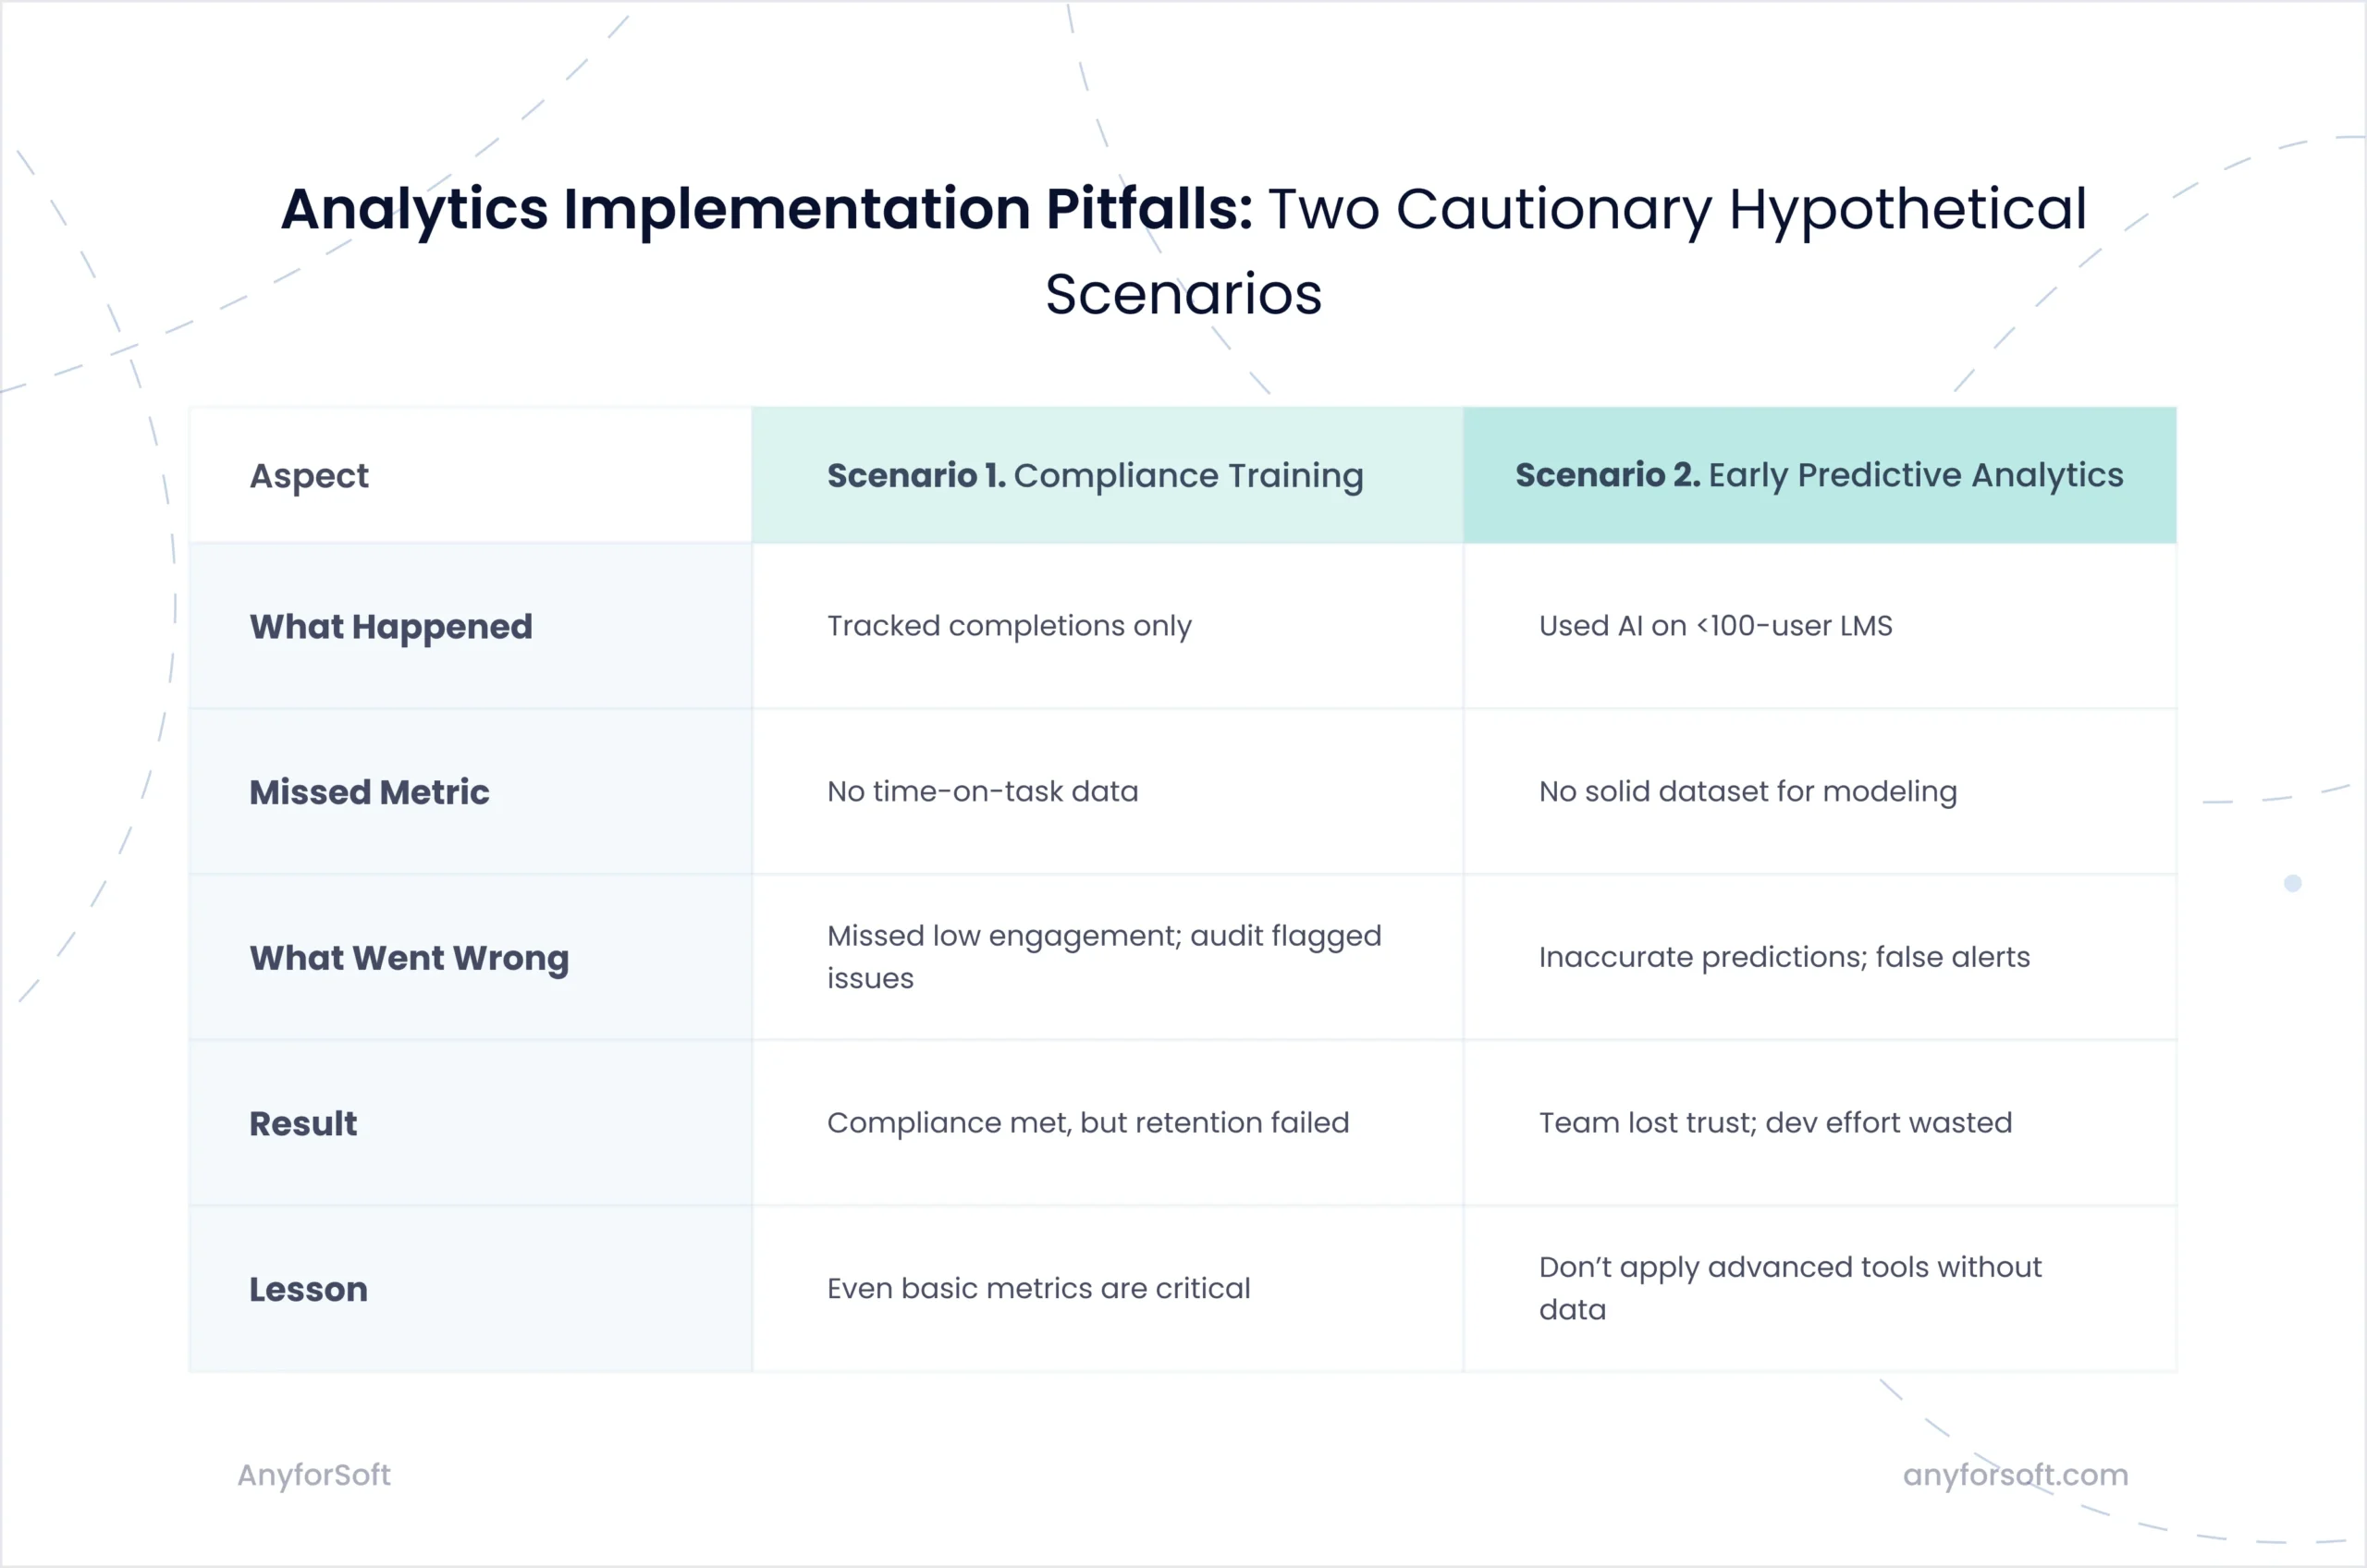
These two scenarios highlight opposite—but equally common—mistakes: overlooking basic metrics that ensure learning effectiveness and rushing into advanced features before the system or data is ready. In both cases, the result is the same: wasted effort, missed insights, and reduced impact.
If you’re unsure where to start or how to scale your LMS analytics setup, our LMS consulting services help you define essential metrics and strategize the development of advanced features tailored to your learning goals, whether you’re building training programs from scratch or optimizing existing online training processes.
Core LMS Analytics: What You Need at Launch
(And maybe these features will turn out to be more than enough for your organization. Let’s see!)
One who has at least some experience in data analysis already guesses which metrics are basic for e-learning.
Think of basic LMS metrics as your step counter and heart rate monitor—simple tools that track progress and keep your development visible, even without advanced diagnostics like predictive analytics.
The good news is that most of the basic features are built into the popular LMSs. We’ll explore this using three LMSs featured in our list of top e-learning platforms.
Another excellent piece of news is that in some cases, basic features are enough anyway – unless your project is expected to scale to a level that redefines the learning platform’s role entirely or support learning initiatives across departments.
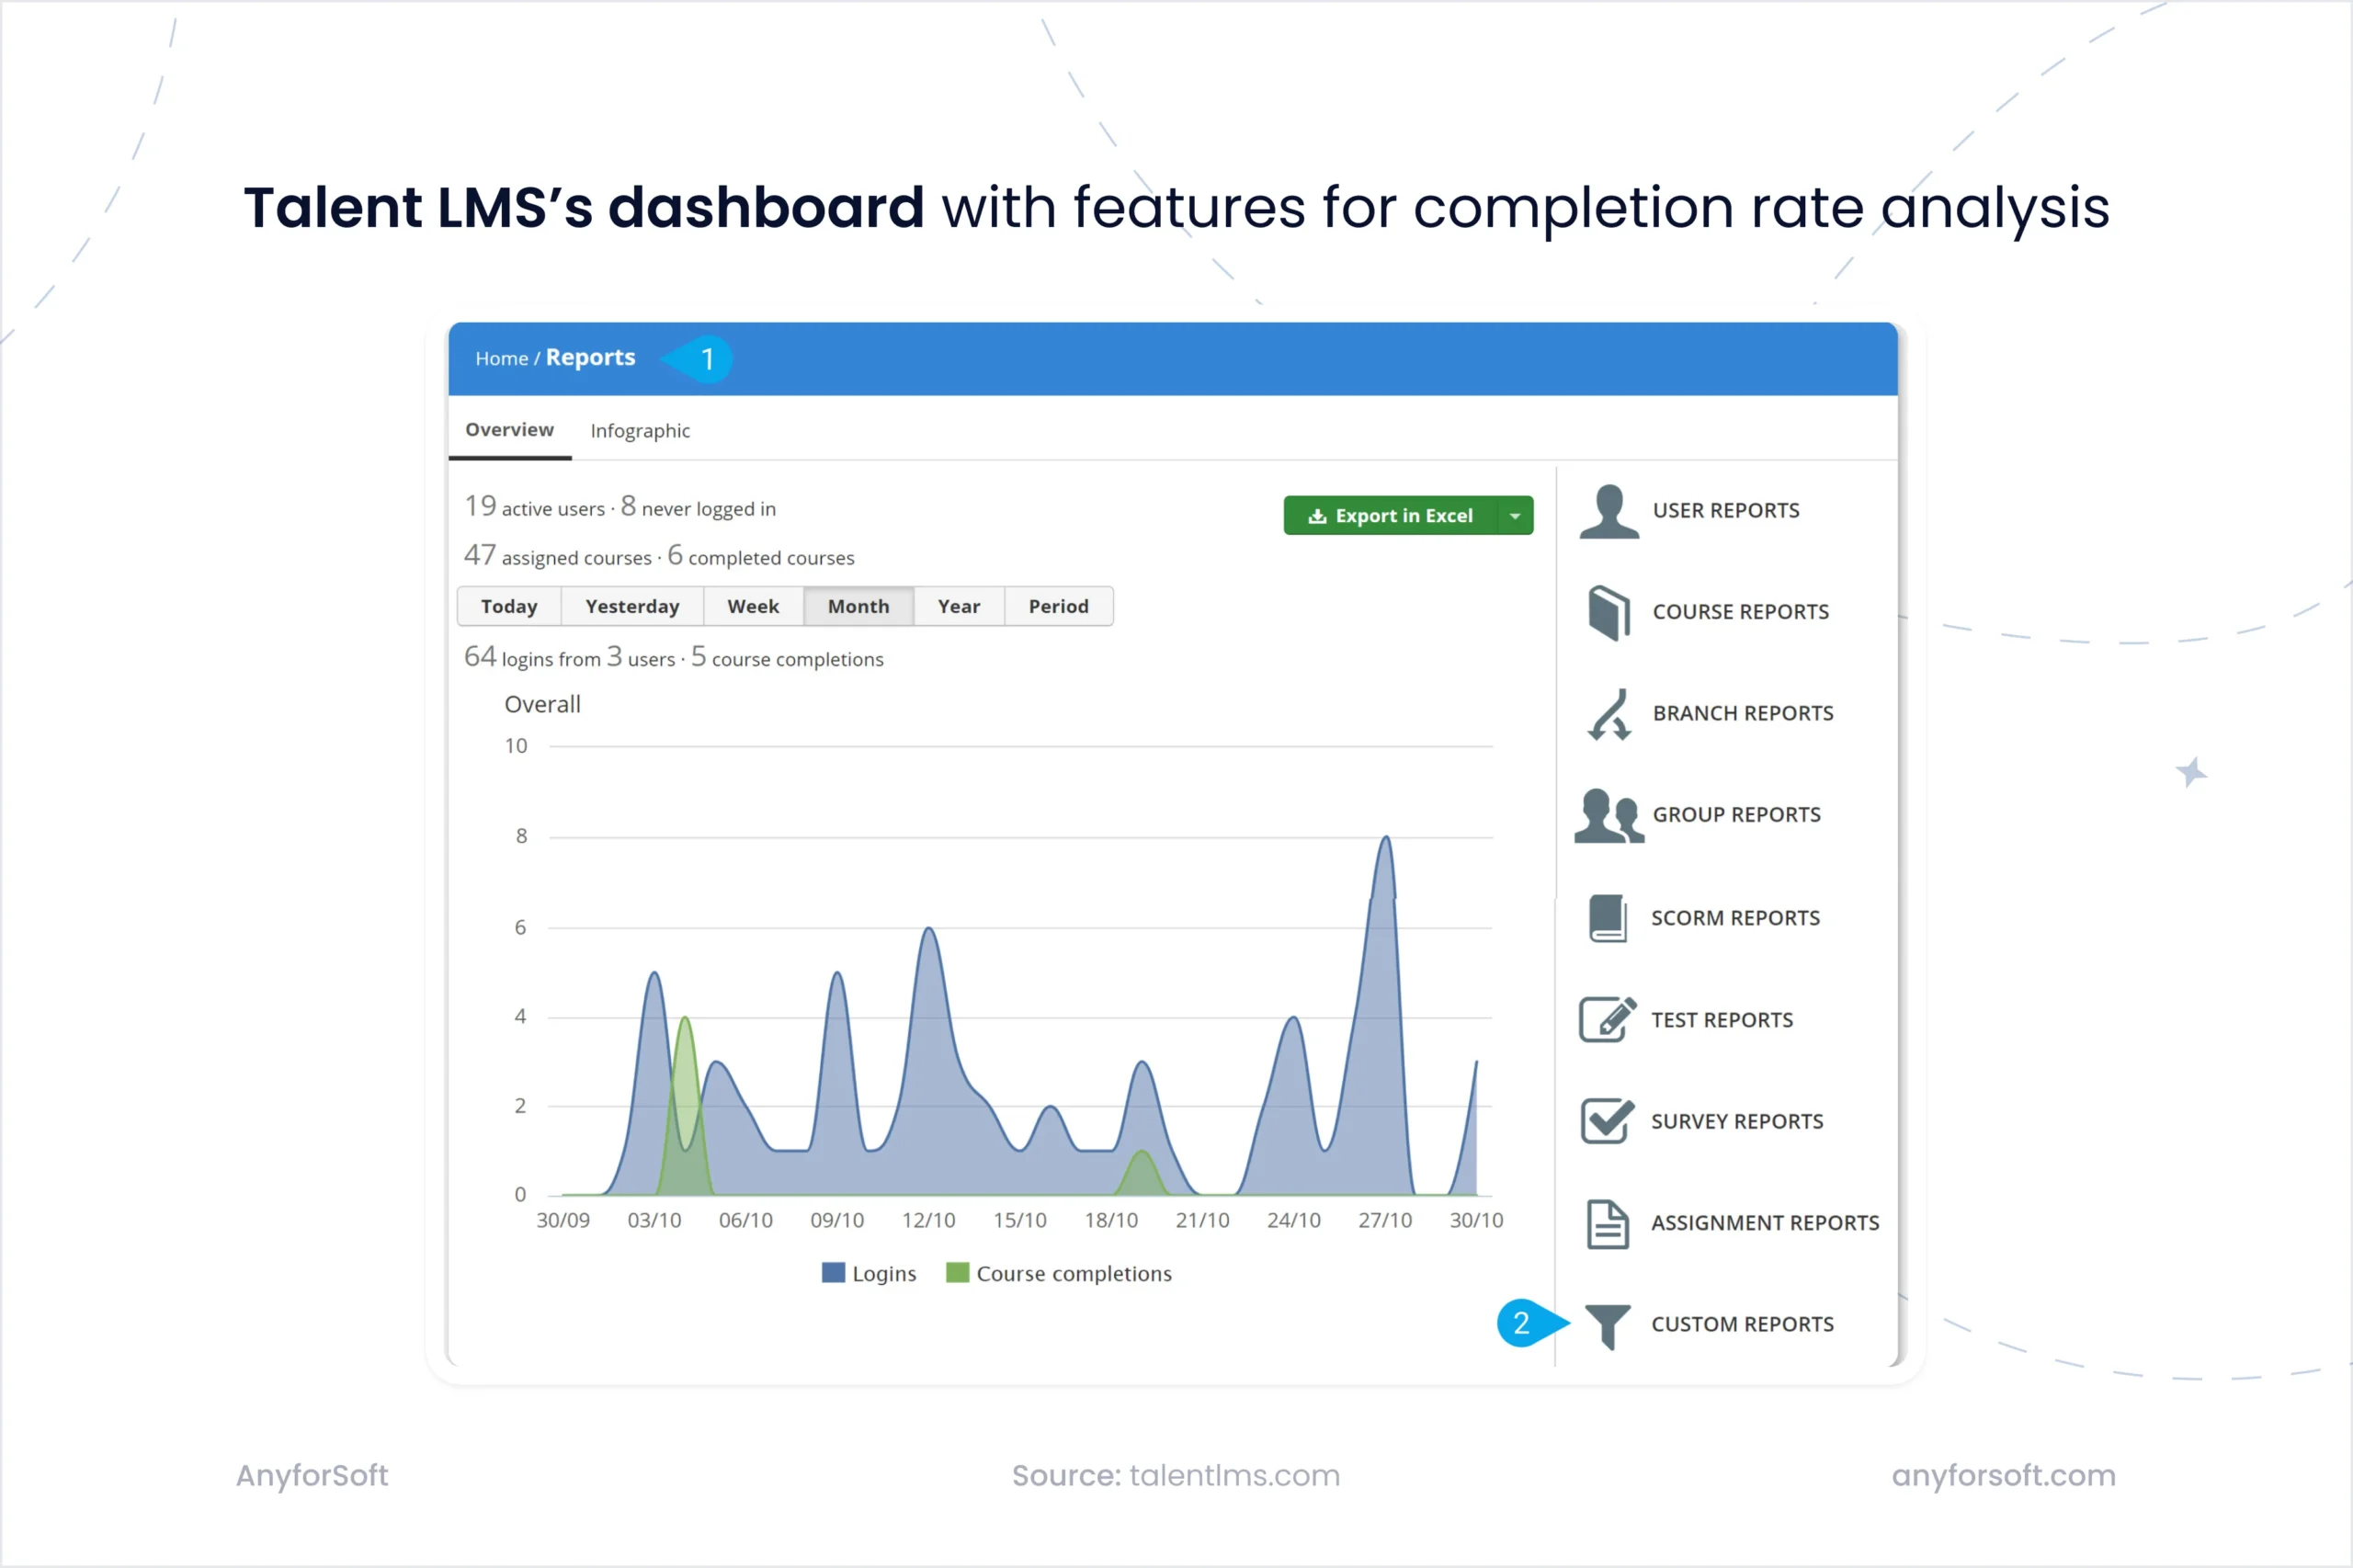
1. Completion Rate
Shows how many learners finish a course, helping you identify drop-offs and measure overall training process effectiveness—crucial for evaluating learning programs.
How it’s organized:
- TalentLMS: Found in course and user reports, with progress shown as percentages. Includes filters by user, group, or branch.
- Moodle: Configurable via “Activity Completion” and “Course Completion” settings. Progress is visible to both learners and instructors.
- Litmos: Included in the standard reporting dashboard and exportable for compliance needs.
2. Drop-off Rate (Where Learners Leave the Course)
Completion rate measures outcomes at the course level. Drop-off rate works at a more granular level. It shows which specific module, lesson, or activity caused learners to stop.
That difference makes it a distinct diagnostic tool: when completion rates are lower than expected, drop-off data points to exactly where the content or pacing breaks down.Drop-off Rate (Where Learners Leave the Course)
Completion rate measures outcomes at the course level. Drop-off rate works at a more granular level — it shows which specific module, lesson, or activity caused learners to stop. That difference makes it a distinct diagnostic tool: when completion rates are lower than expected, drop-off data points to exactly where the content or pacing breaks down.
How it’s organized:
- TalentLMS: No dedicated drop-off metric is available natively. The Timeline feature logs every user action on the platform, and the Training Matrix shows course-level progress by status. Drop-off patterns can be inferred by analyzing this data, but doing so requires custom reporting configuration.
- Moodle: Activity completion logs record where learners engaged and where they stopped, providing a data foundation for drop-off analysis. Moodle also includes a built-in predictive model that flags learners at risk of not completing a course — though this identifies at-risk users rather than pinpointing specific abandonment points in the content.
- Litmos: Module-level completion is trackable through the Reporting Engine, allowing admins to compare completion rates across individual modules and identify where learners consistently stop. A dedicated drop-off view is not available natively, but the underlying data supports building one.
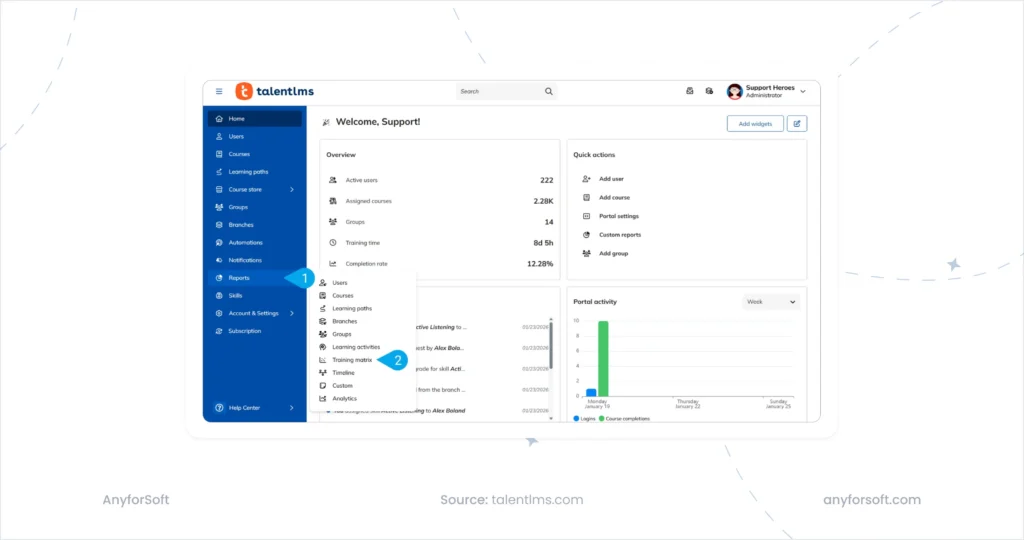
TalentLMS Reports menu showing the Training Matrix (2) and Timeline options. (Source)
3. Average Course Completion Time
Completion rate tells you whether learners finished a course. Average course completion time tells you how long it took, meaning the elapsed time between enrollment and completion.
A course completed in a fraction of the estimated time may signal that learners are skipping through content. Unusually long completion times can indicate pacing or structural issues.
How it’s organized:
- TalentLMS: Time spent per unit is logged in User Reports, with exact completion timestamps available. Average completion time across learners can be calculated from this data, but requires manual analysis or a custom report configuration.
- Moodle: The Course Completion Report records completion timestamps alongside enrollment dates, providing the raw data needed to calculate elapsed time. Moodle does not compute or display average completion time natively; deriving it requires additional configuration or a plugin.
- Litmos: Completion timestamps are available through the Reporting Engine and can be used to build a custom report showing time-to-completion per learner. As with the other platforms, no dedicated average completion time metric exists out of the box.
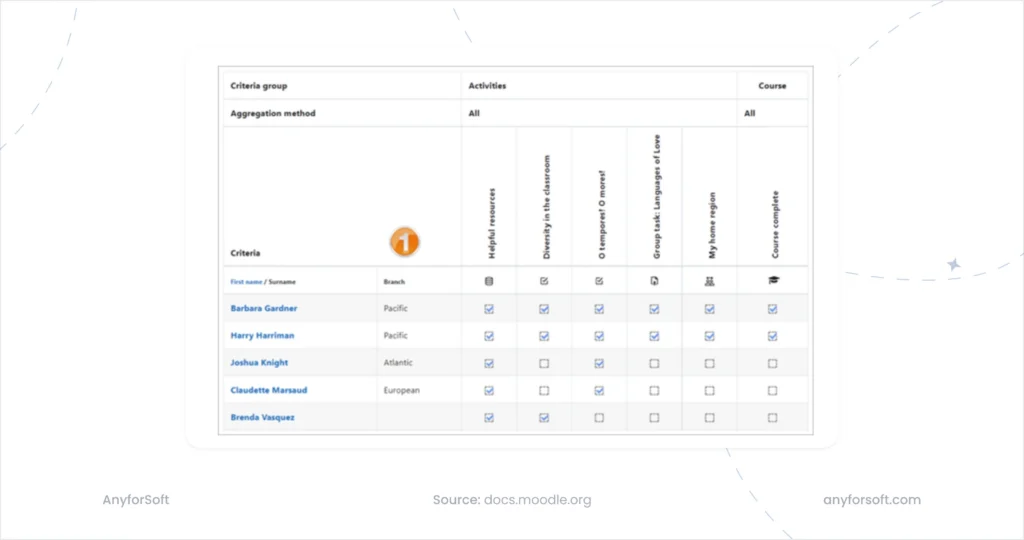
Moodle’s Course Completion Report shows activity-level completion status per learner, but contains no elapsed time data. Calculating average course completion time requires additional configuration or custom development. (Source)
4. Assessment Scores (Quiz Results, Test Performance)
Measure quiz and test performance, showing how well learners grasp the material; they help identify struggling users and improve course effectiveness.
How it’s organized:
- TalentLMS: Accessible via course reports, with details on test performance, average scores, and completion stats.
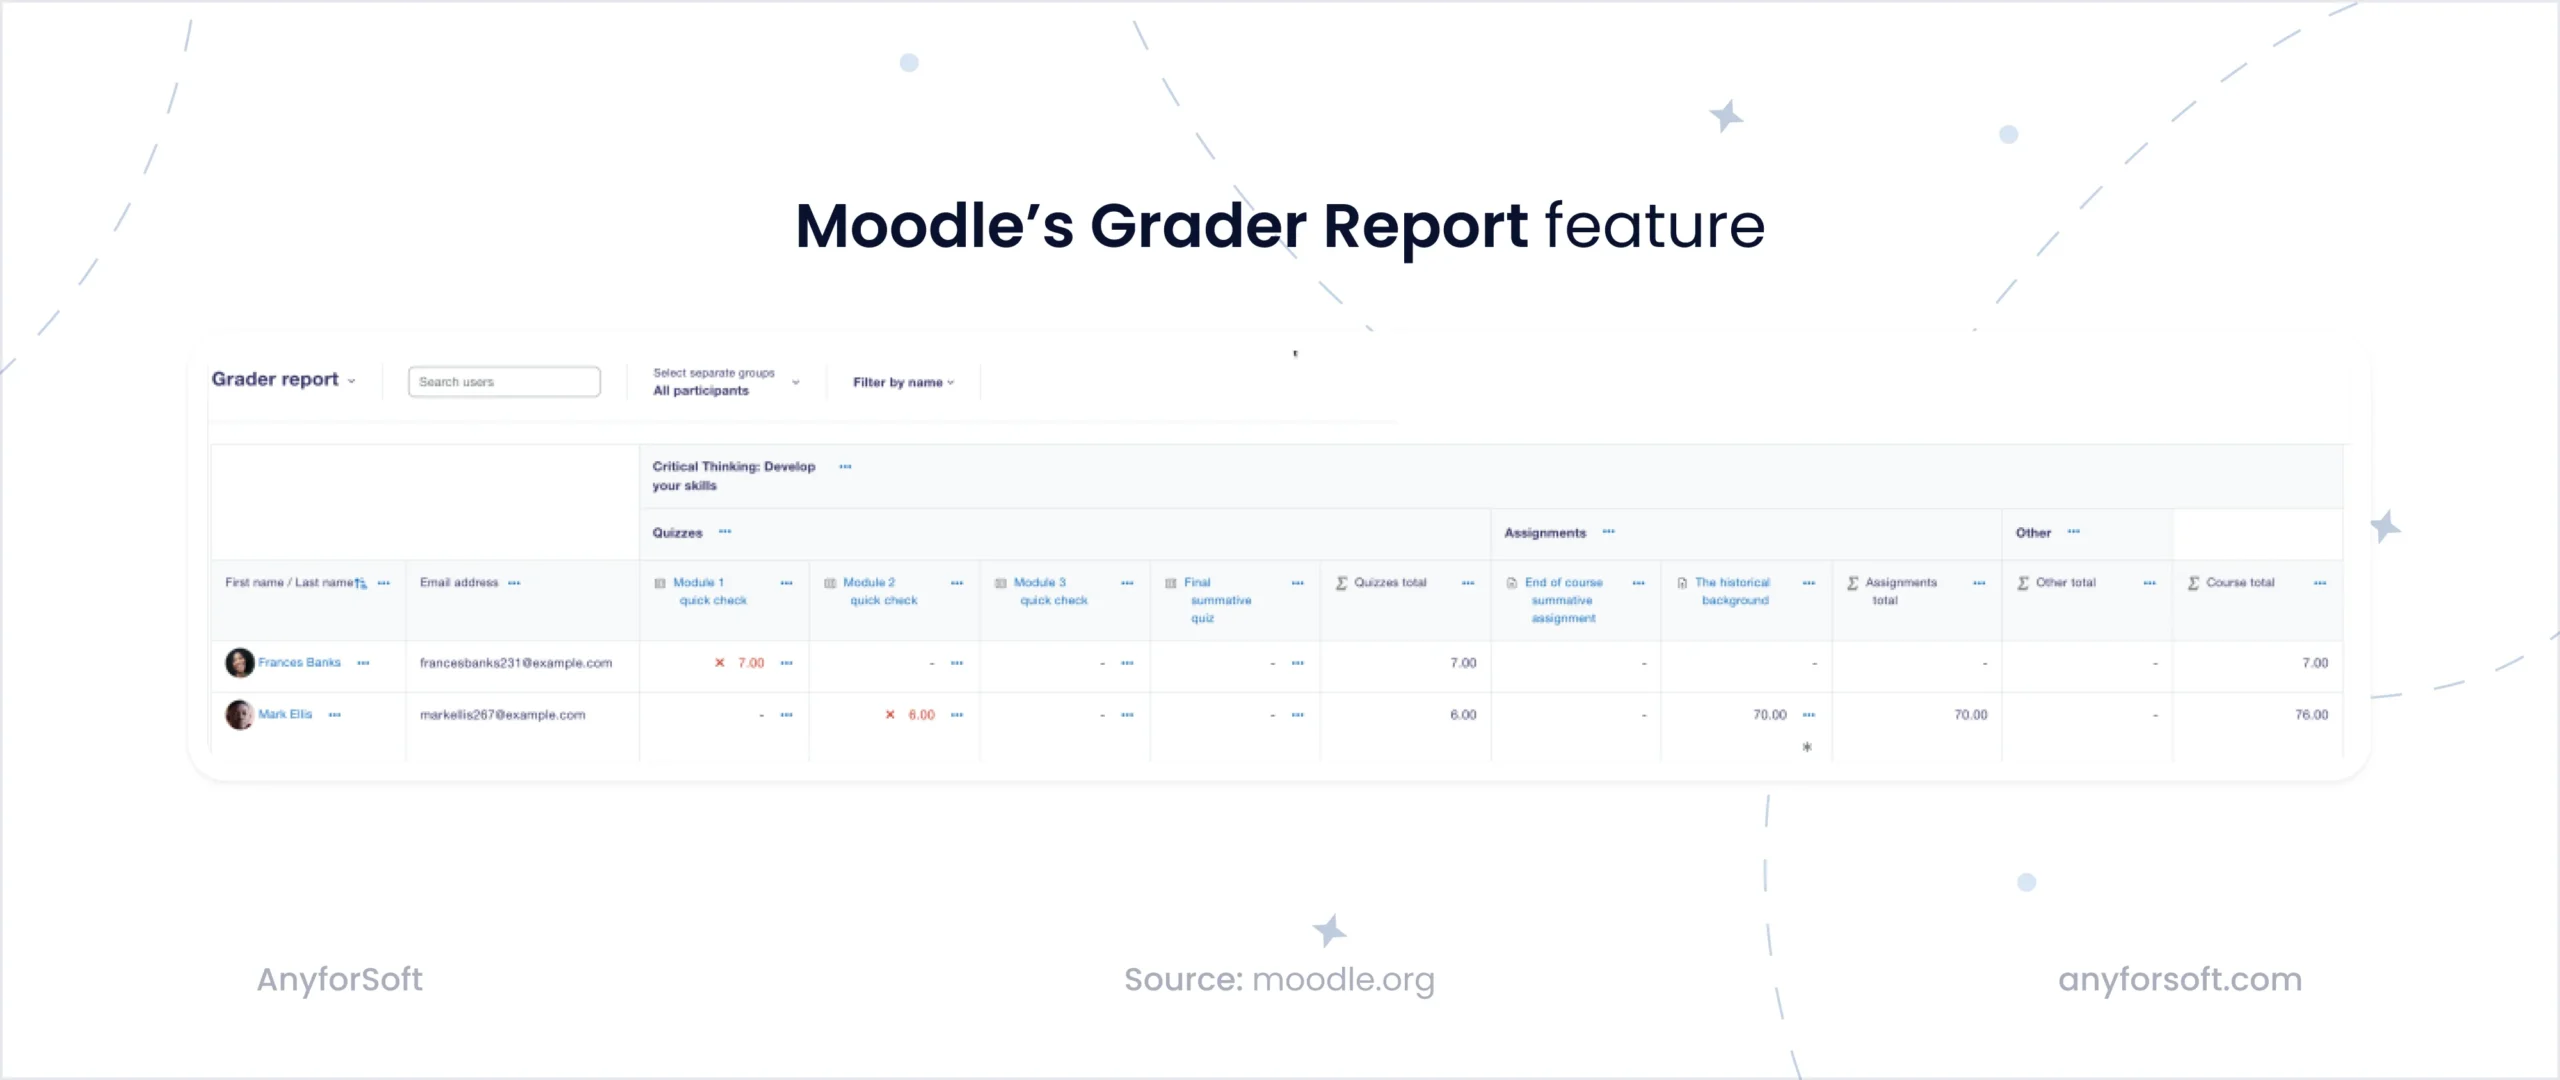
- Moodle: The “Grader Report” consolidates graded items from various assessments, allowing instructors to view and edit grades.
- Litmos: Offers features to create and manage quizzes and assessments, enabling the tracking of learner performance and understanding.
5. Time-on-Task (Time Spent in Course)
Time-on-Task measures how long learners spend in a course or on specific activities, helping assess engagement, pacing, and whether the training is being meaningfully completed.
How it’s organized:
- TalentLMS: Tracks time spent per unit; learning data is available in user activity reports.
- Moodle: Time-on-task isn’t tracked by default, but plugins like Block Dedication can estimate study time based on learner activity—though the data may not always reflect true engagement.
- Litmos: While it doesn’t natively track time spent on individual activities, administrators can monitor overall course engagement through available analytics.
6. Login Frequency and Access Patterns
On the LMS analytics dashboards, the metric shows how consistently users are engaging with the learning platform. Irregular login patterns can signal disengagement or friction in the learning experience.
How it’s organized:
- TalentLMS: Overview and user reports display login trends and session frequency over custom time ranges.
- Moodle: “Activity Reports” provide insights into user login frequency and participation patterns, aiding in monitoring engagement levels.
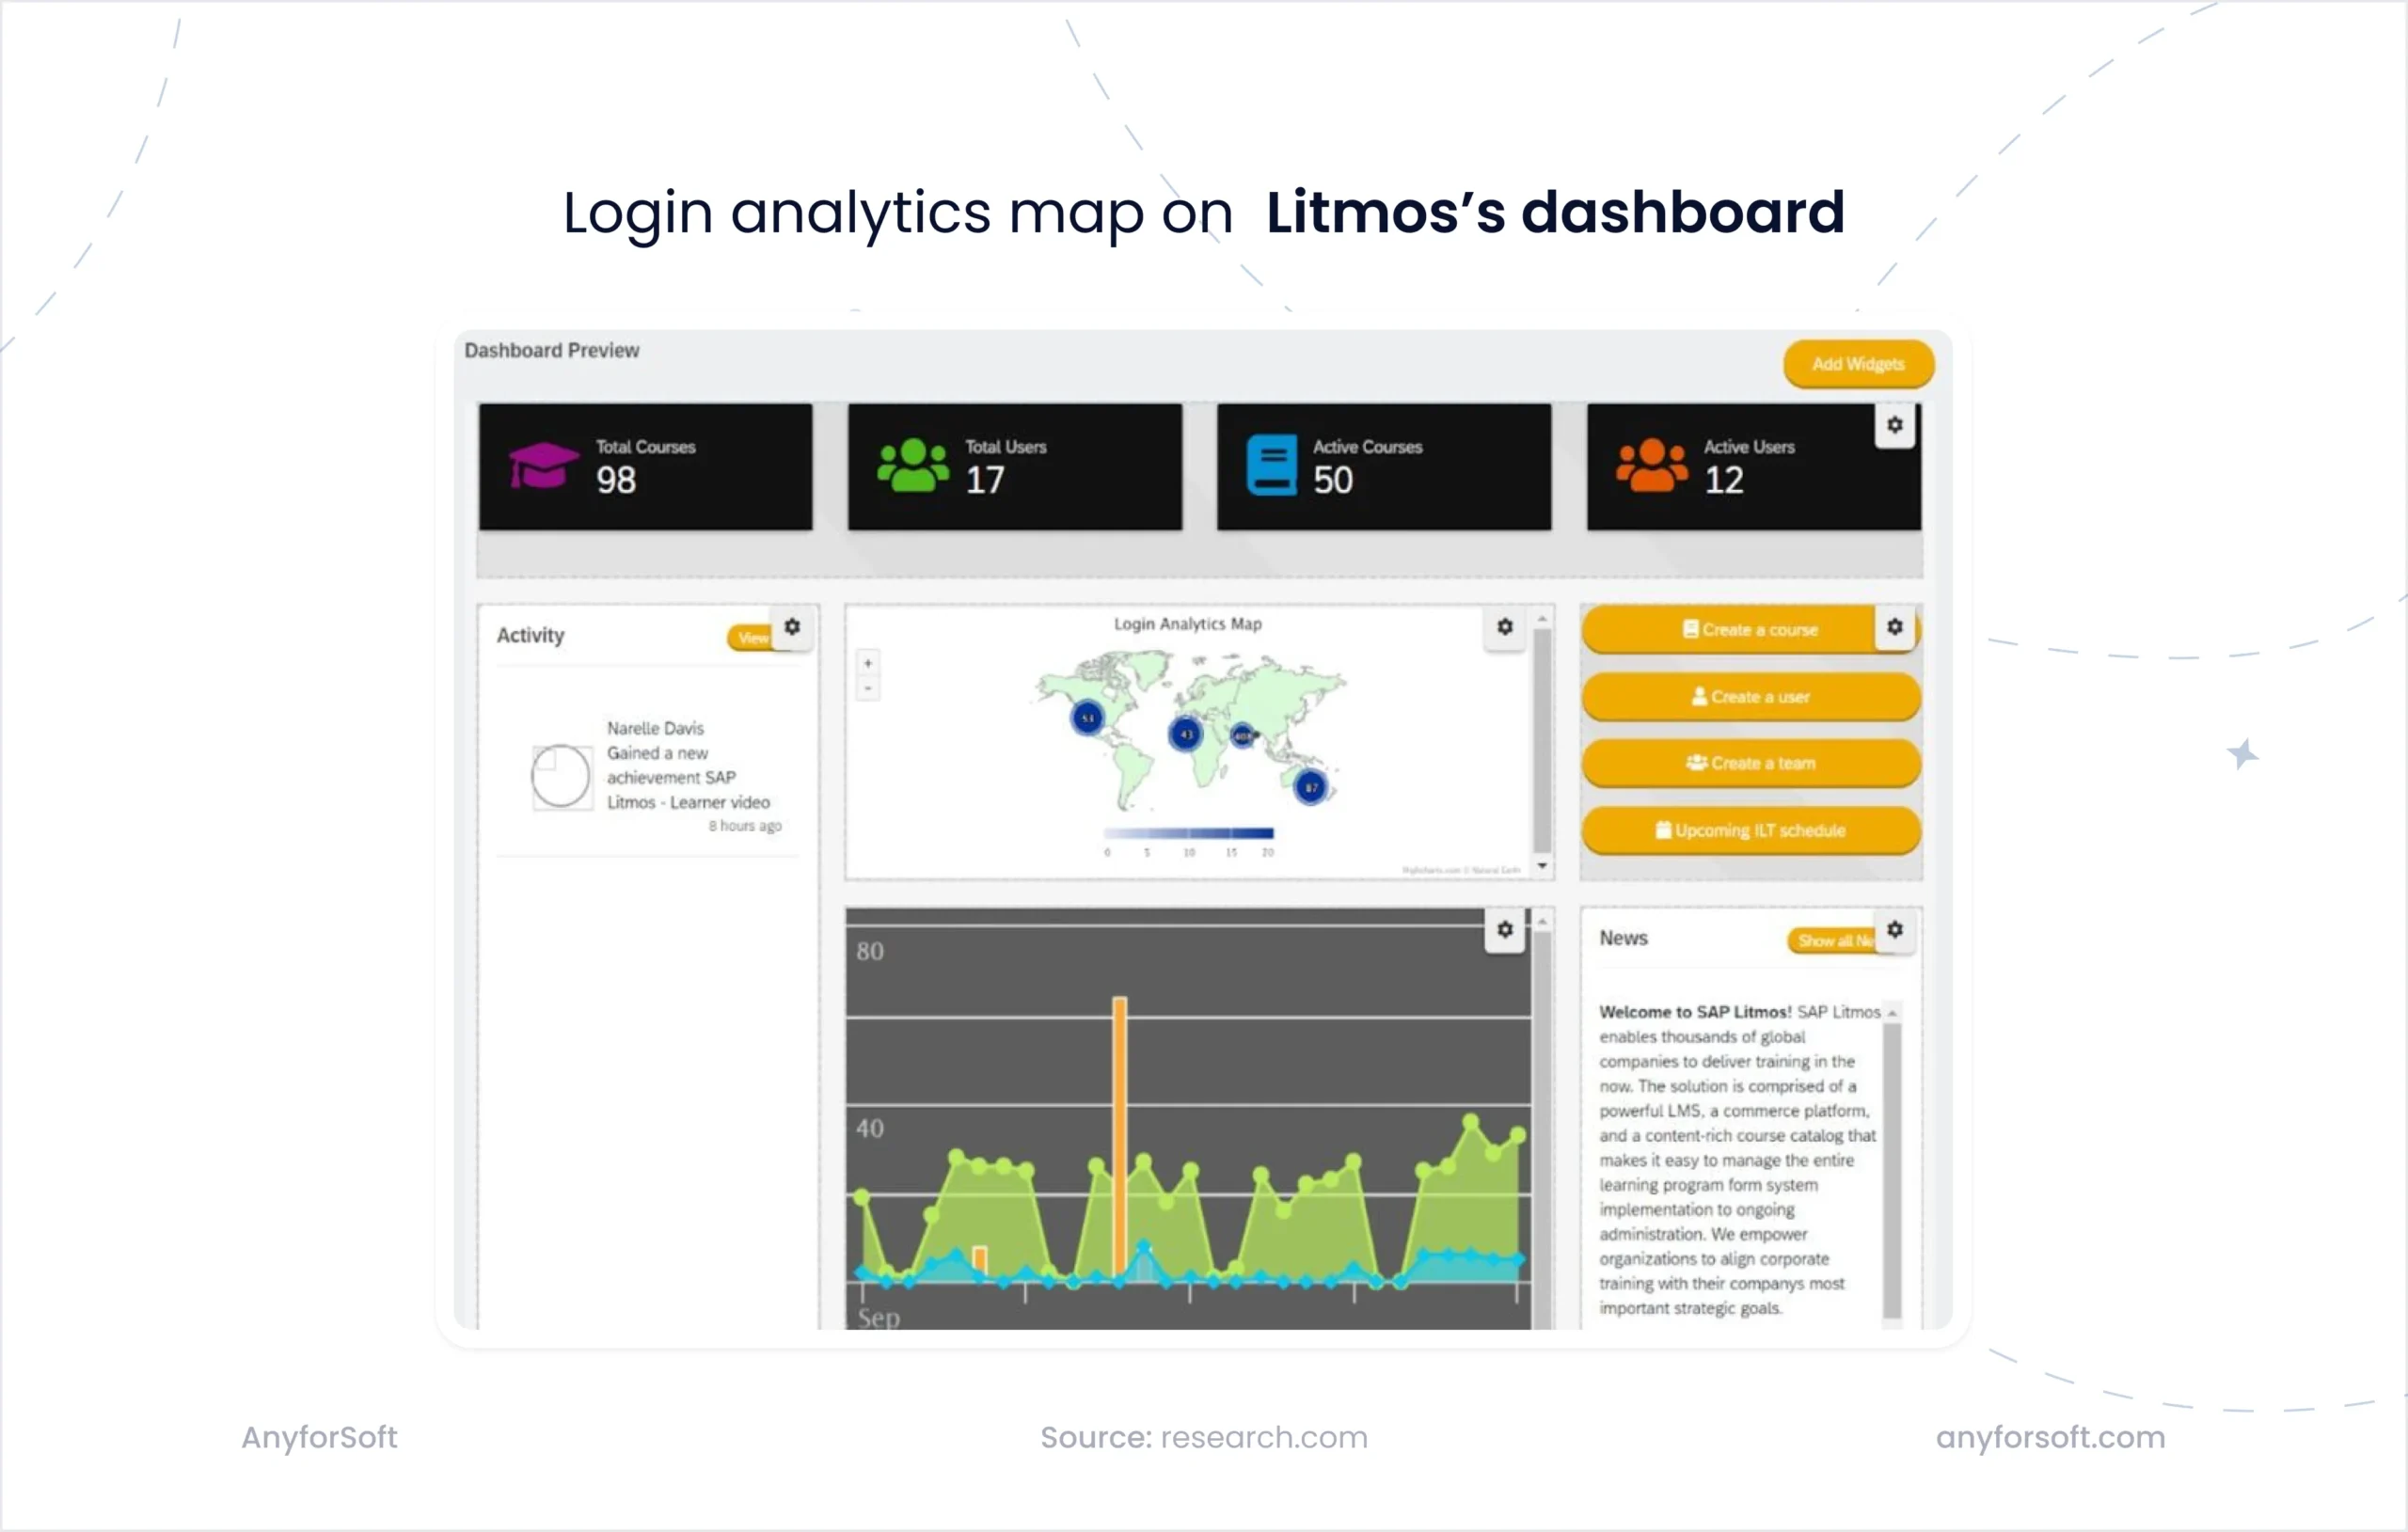
- Litmos: Includes LMS data analytics to observe user login frequency and engagement patterns, assisting in identifying trends in learner participation.
7. Progress Tracking
Indicates how much of the course a learner has completed, offering a clear picture of advancement that helps admins monitor learning flow, support learning and development efforts, and keeps learners motivated to continue.
How it’s organized:
- TalentLMS: Progress is shown as a percentage in course/user reports. Easily viewable per learner.
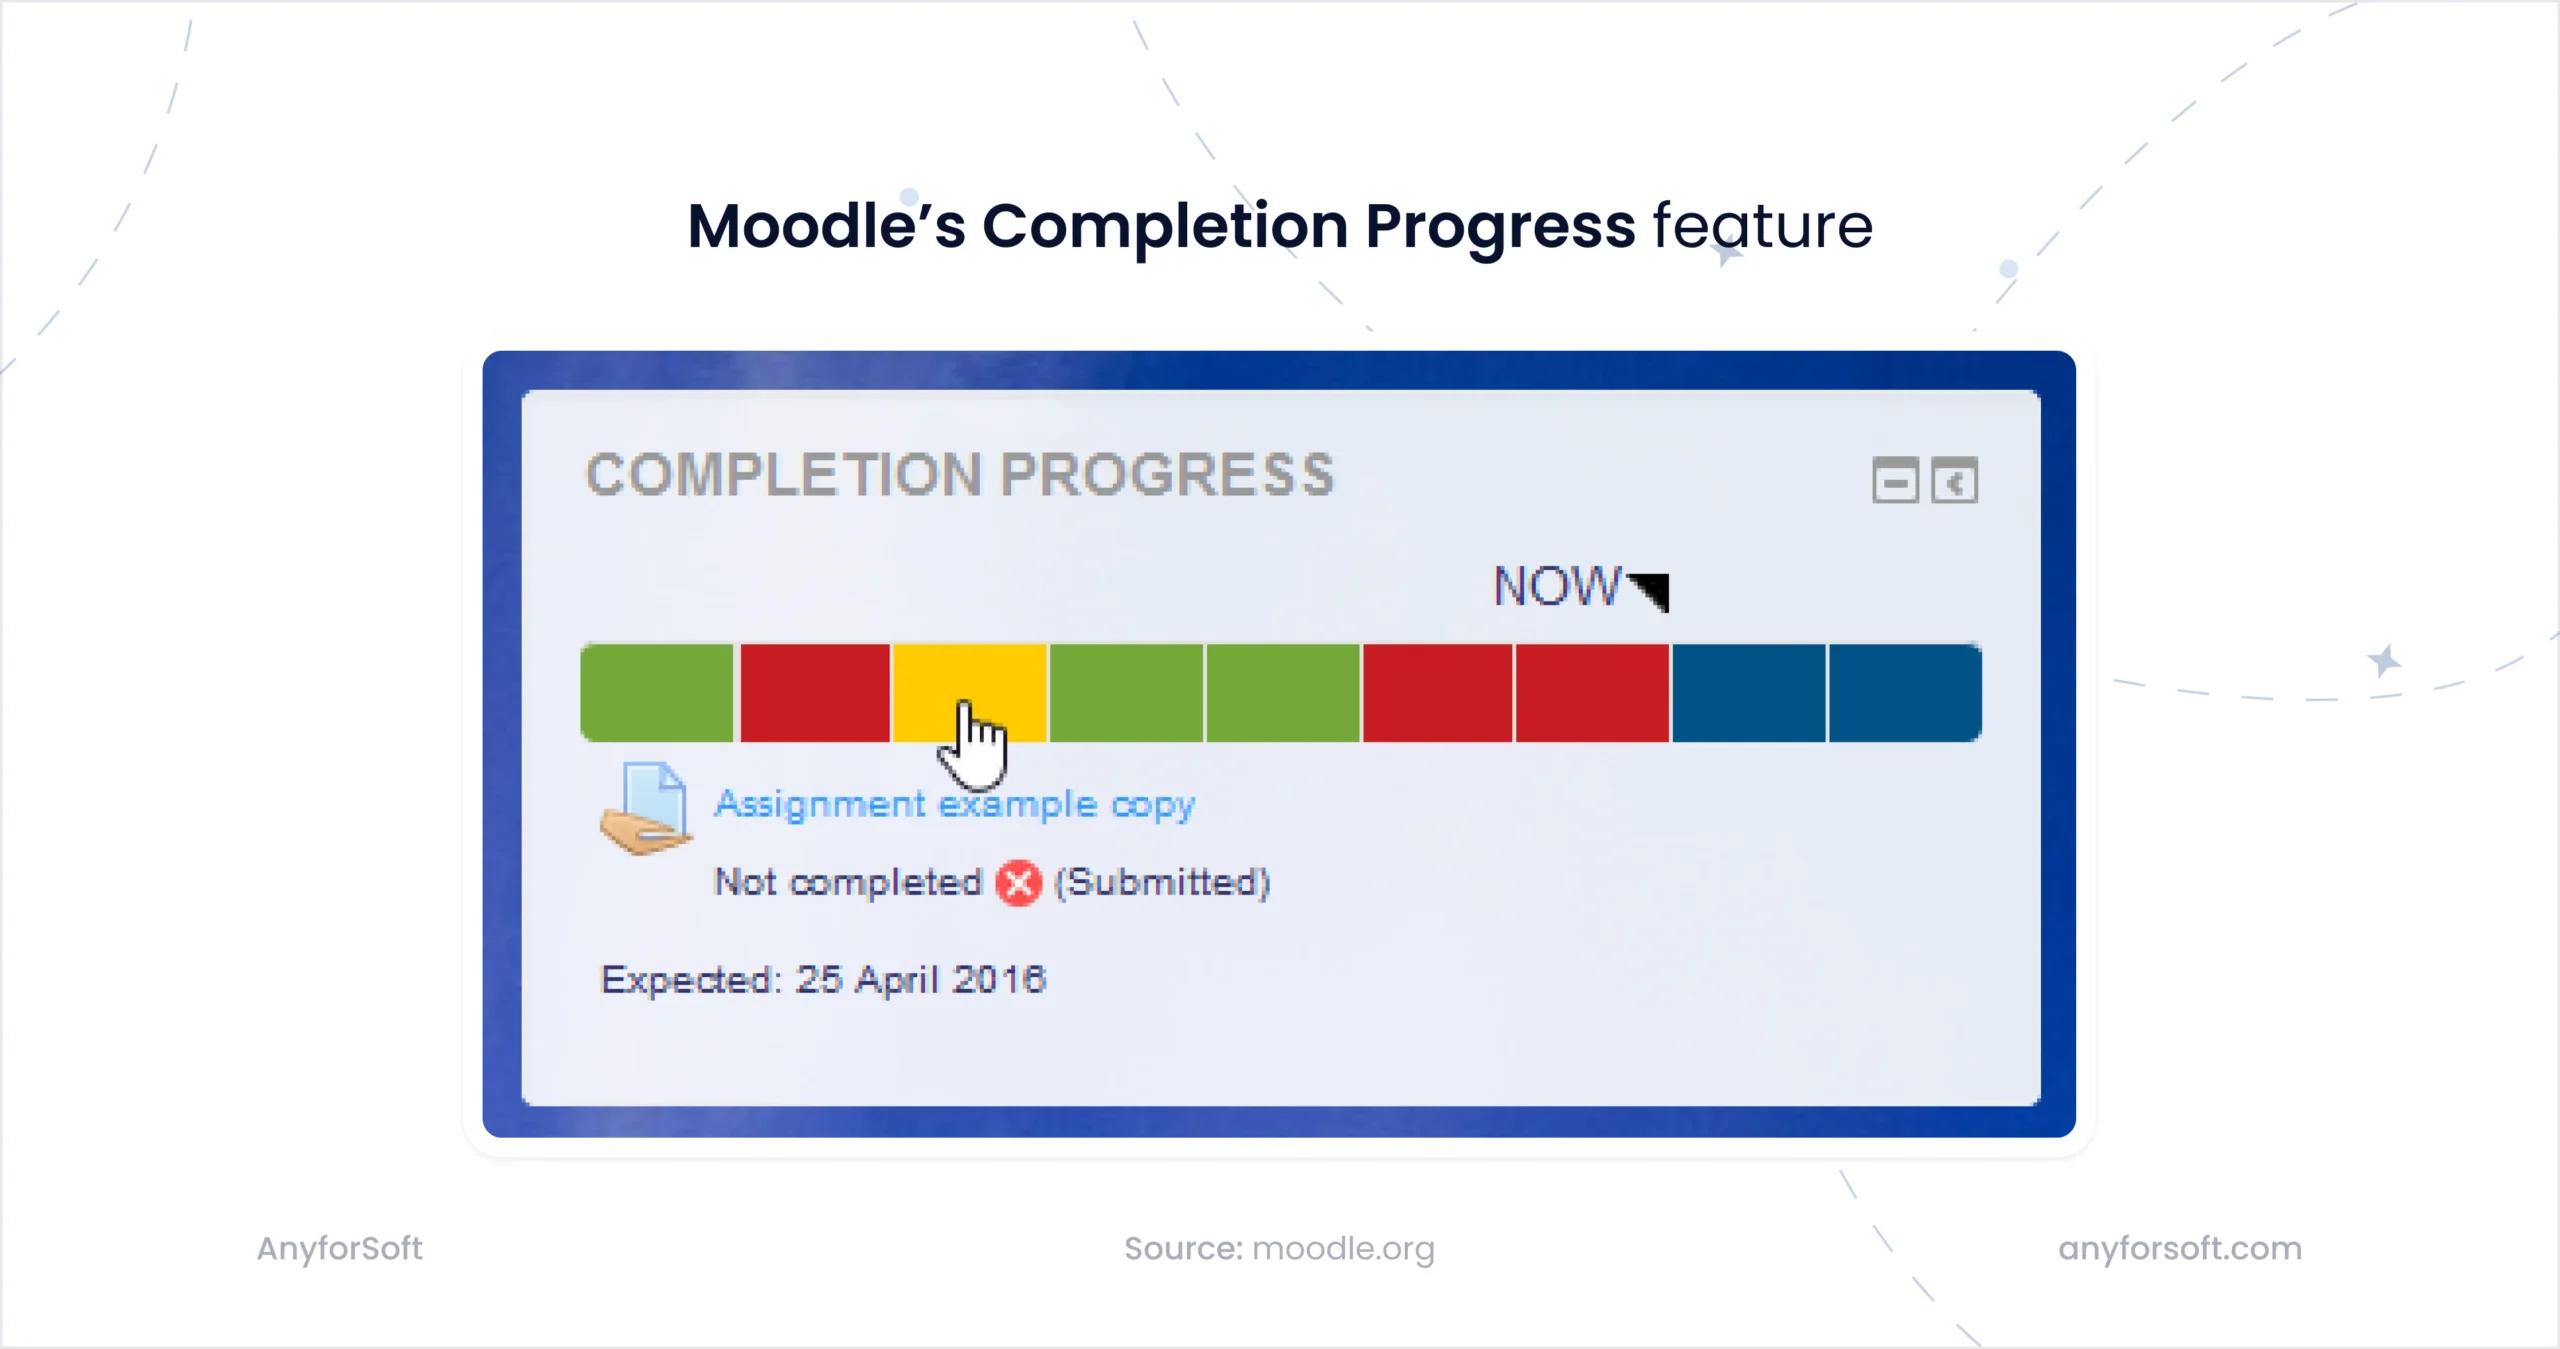
- Moodle: The “Completion Progress” block offers a visual representation of student progress, allowing both students and teachers to monitor advancement through course materials.
- Litmos: Supports tracking of learner progress through courses, offering insights into completion percentages and areas where learners may need additional support.
8. Feedback & Satisfaction Scores (Surveys)
Quantitative metrics only tell part of the story. Gathering user feedback helps you understand learner sentiment and identify UX issues or content gaps.
How it’s organized:
- TalentLMS: Built-in survey units can be added to courses; results are available in the LMS reporting section.
- Moodle: The built-in Feedback activity lets educators create custom surveys to gather learner opinions and course evaluations.
- Litmos: Does not offer native survey tools but supports integration with third-party survey platforms for collecting learner feedback.
Basic LMS Metrics at a Glance
- Completion Rate
Tracks how many learners finish a course—reveals drop-offs and training effectiveness, crucial for evaluating learning programs.
- Assessment Scores
Measures quiz and test results—shows learner understanding and course quality.
- Time-on-Task
Estimates how long users spend learning—helps evaluate learner engagement and pacing.
- Login Frequency
Monitors platform access patterns—flags disengagement or usage issues.
- Progress Tracking
Shows how far learners have advanced—keeps admins informed and learners motivated.
- Feedback & Satisfaction
Captures user opinions—uncovers UX gaps and content improvement areas.
You don’t need advanced analytics tools to get started, but you do need to know how to act on these essentials. For a broader overview of reporting capabilities worth tracking, we’ve covered that in a separate guide. And when your needs expand, these essentials will serve as a stable foundation for more complex LMS data analytics down the road.
Advanced LMS Analytics: When You’re Ready to Scale
(Or when your LMS needs to meet niche LMS reporting requirements).
Once your core LMS metrics are in place and your platform is delivering value, it may be time to go further.
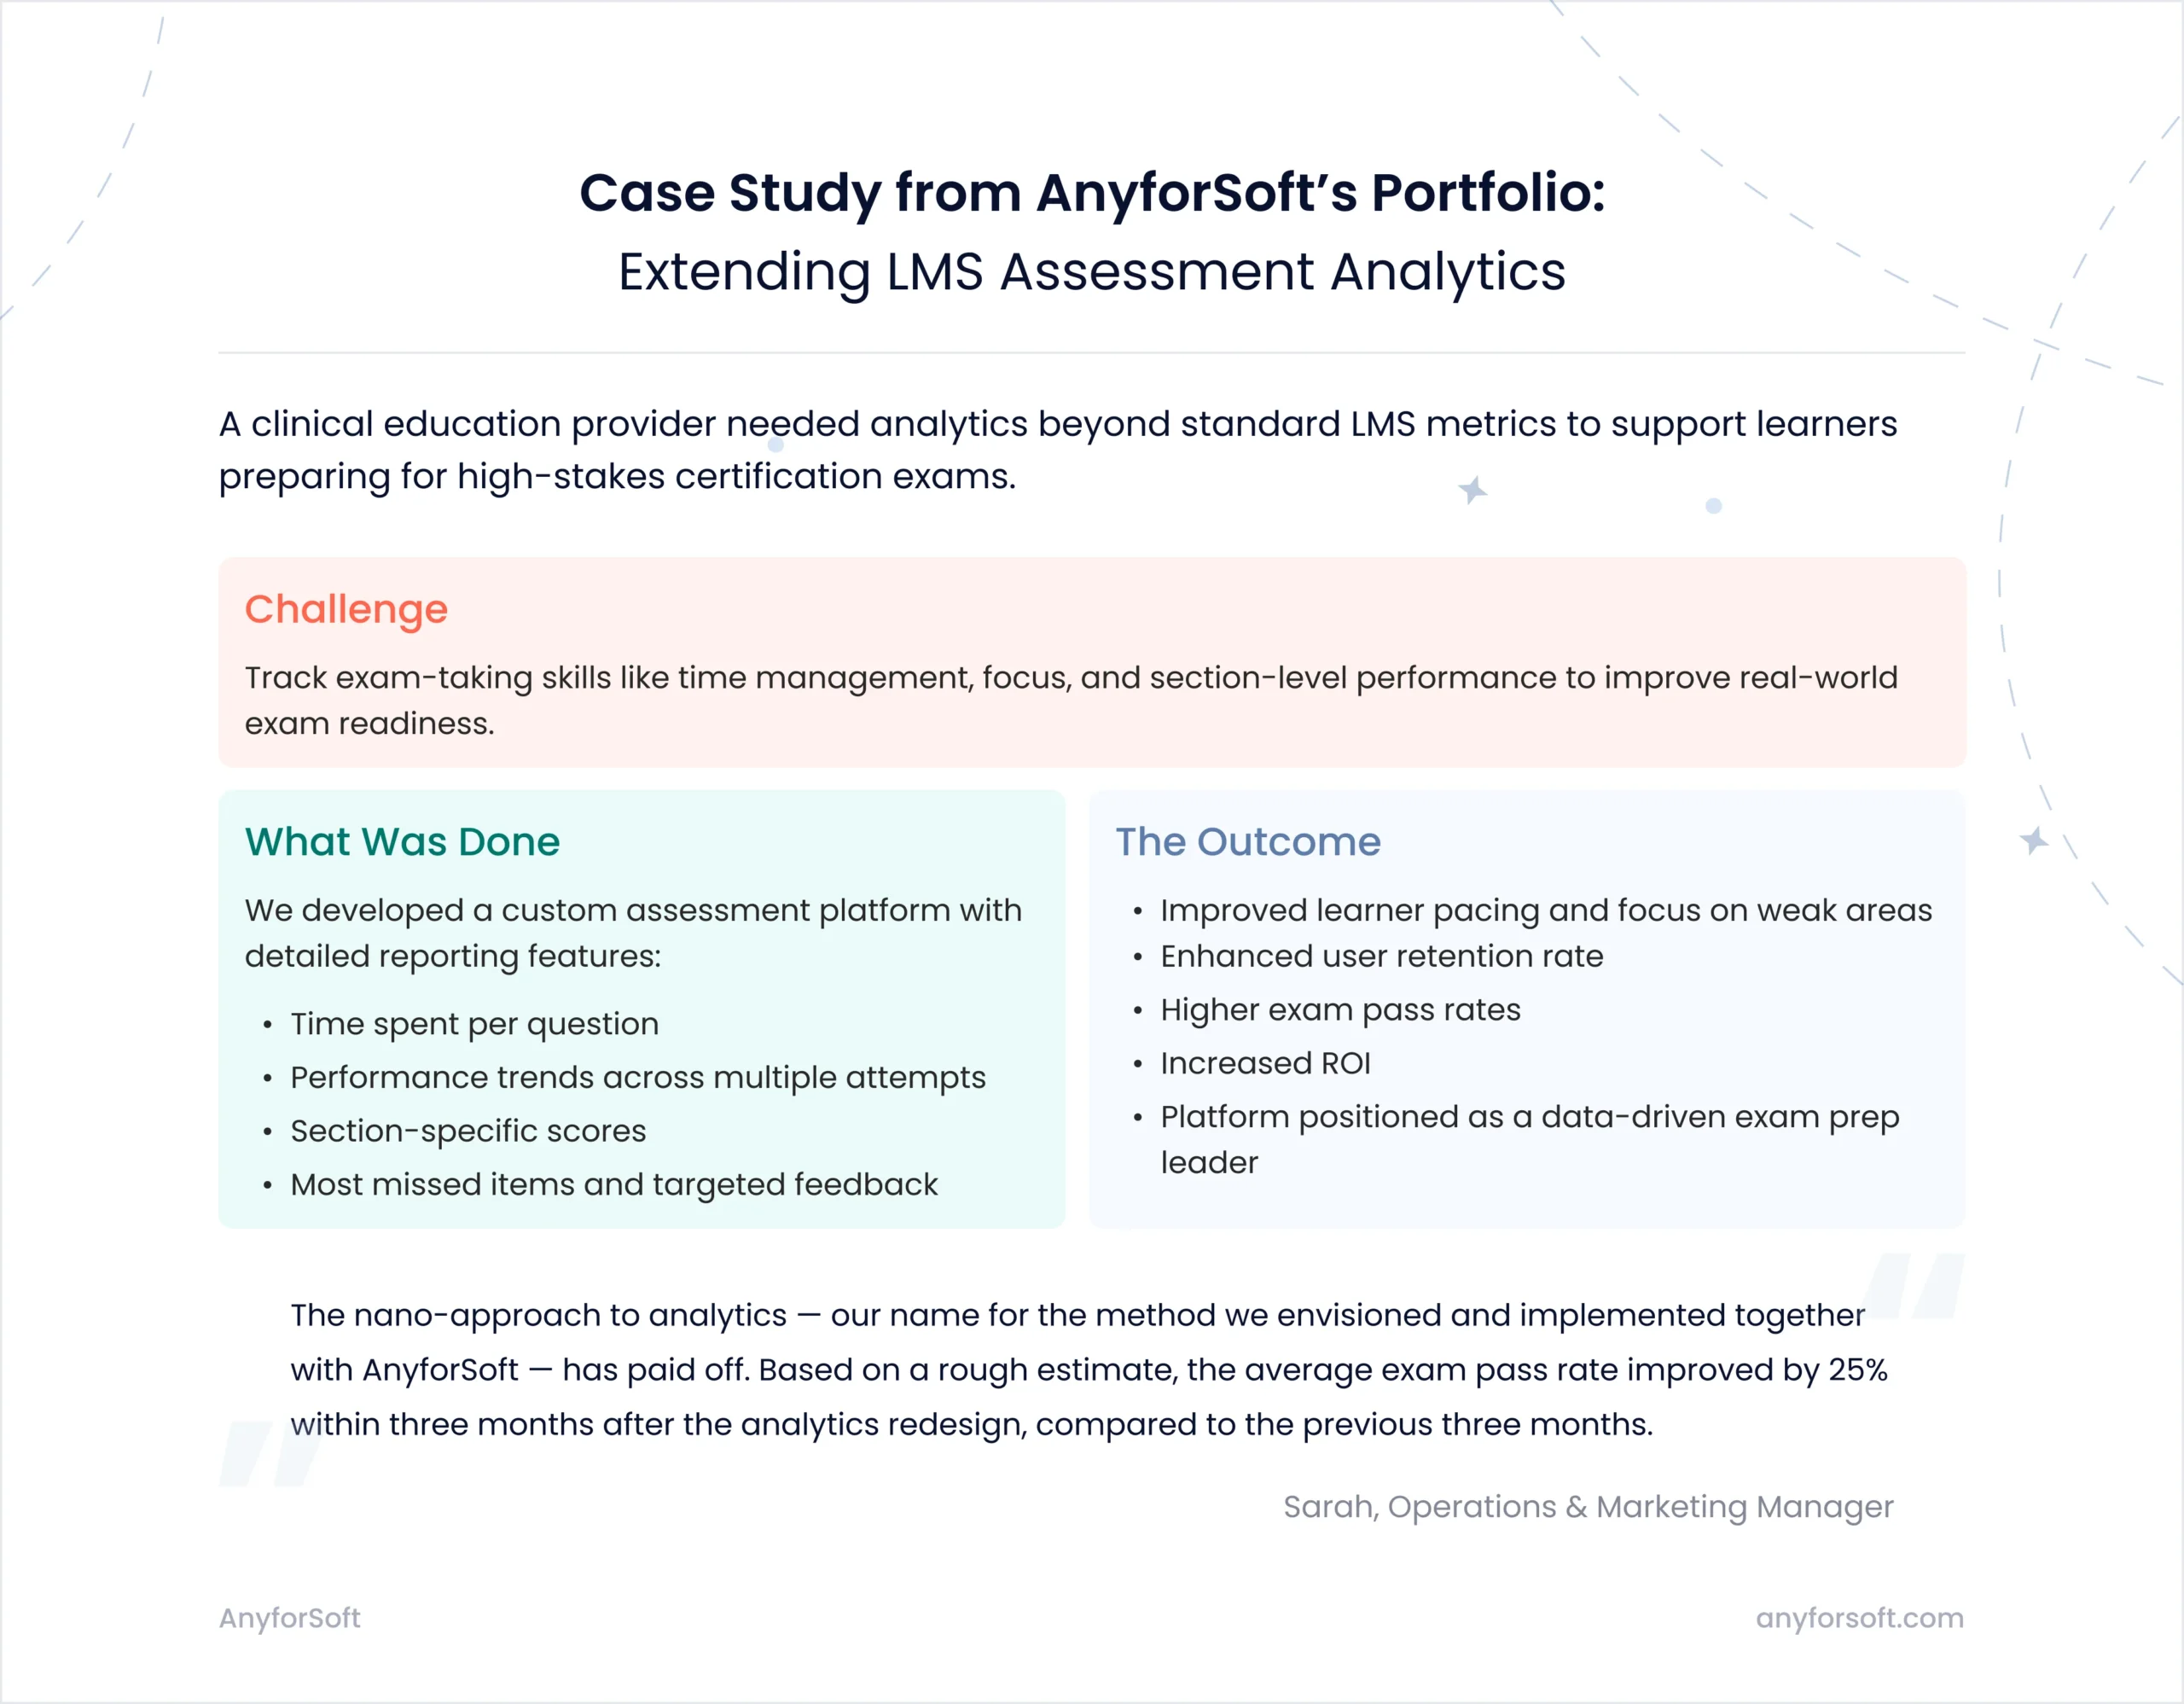
Alternatively, your LMS might need to meet niche reporting requirements going beyond such standard metrics like course completion rates. The case from the practice of Anyforsoft, the LMS development company, is a good example of how an individual approach and wise customization add value to the learning experience and help improve engagement across learning programs.
Advanced metrics add value to LMS reporting workflows; however, you can’t just snap your fingers and make the corresponding features happen. Advanced LMS learning analytics typically require larger datasets, custom development, or integration with third-party tools.
For corporate training initiatives and broader learning and development strategies, these insights are key to tracking employee performance and long-term online learning ROI.
To give you a general sense of effort and feasibility, we’ve added a rough complexity scale (1–5) for each feature—intended as a ballpark estimate, not a rigid benchmark.
Let’s take a look at these features, focusing on three points:
- What influence does the LMS report metric have on learning efficiency?
- Which efforts and technologies does it need for implementation?
- What is the feature’s complexity in a figure?
Please note that a complexity scale (1–5) for each feature is rough. It’s intended as a ballpark estimate, not a rigid benchmark.
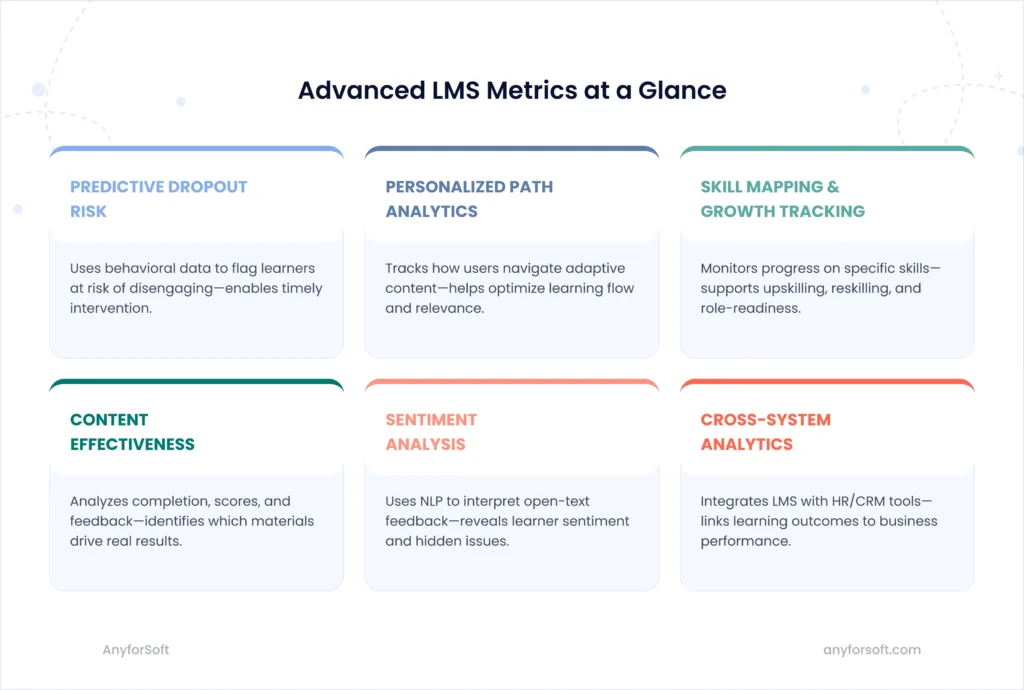
1. Predictive Dropout Risk
Helps identify learners likely to disengage based on behavioral patterns like low login frequency, long gaps between sessions, or repeated failed assessments. Early intervention can improve retention and reduce wasted training costs.
How it works:
Requires collecting data on user behavior over time and applying machine learning models (e.g., logistic regression or decision trees) to predict dropout probability. Cloud AI tools (e.g., Google Cloud, Azure ML) or Python-based custom models are often used.
Estimated implementation complexity: ★★★★☆ (4/5)
Requires a clean dataset, modeling expertise, and ongoing refinement to maintain accuracy.
That impact has a name: Learning ROI. It measures whether training activity actually moves the needle on business performance. Without cross-system data, ROI remains a completion report. With it, training results can be measured against actual business performance rather than learning activity alone.
2. Personalized Learning Paths Analytics
Tracks how individual learners move through adaptive content and branching modules. Helps evaluate whether personalization strategies are working and where learners need better support.
How it works:
Requires tracking engagement with conditional content, analyzing user behavior patterns, and creating rules or algorithms for path optimization. May involve logic-based rules or AI-driven recommendations.
Estimated implementation complexity: ★★★☆☆ (3/5)
Depends on content structure and platform flexibility. Easier if your LMS already supports branching; harder if building logic from scratch.
3. Skill Mapping and Growth Tracking
Moves beyond course completion to show which specific skills learners are developing—essential for upskilling, reskilling, and internal mobility planning.
How it works:
Involves linking course content and assessments to a predefined skill framework and tracking learner progress over time. Often implemented using competency models or role-based learning matrices.
Estimated implementation complexity: ★★★★☆ (4/5)
Requires thoughtful content tagging, reporting logic, and a skill taxonomy aligned with business roles.
4. Content Effectiveness Analysis
Goes beyond usage stats to determine whether your courses are truly working—by analyzing performance trends, feedback quality, and engagement depth.
How it works:
Combines multiple data sources (scores, completion rates, rewatch behavior, survey responses) to identify high- and low-performing content. May include automated dashboards or manually synthesized reports.
Estimated implementation complexity: ★★★☆☆ (3/5)
Feasible with strong LMS reporting tools or BI dashboards. More advanced insights require integrations and custom KPIs.
5. Sentiment Analysis and Feedback Correlation
Extracts meaning from open-text feedback to uncover learner sentiment trends—helping you spot hidden issues and improve learning experience quality.
How it works:
Uses Natural Language Processing (NLP) models to classify text responses (positive/neutral/negative), and links sentiment to performance or engagement metrics. Can be implemented via APIs (e.g., Google Cloud NLP, AWS Comprehend) or custom models.
Estimated implementation complexity: ★★★★☆ (4/5)
Requires external tools or machine learning expertise, plus integration and data cleaning.
6. Cross-System Analytics (LMS + HR/CRM)
Combining LMS data with business systems unlocks a broader view of training ROI, employee performance, and compliance health.
How it works:
Data must be pulled from multiple platforms (e.g., LMS, HRIS, CRM) using APIs or middleware tools. Requires aligned data structures and governance policies.
Estimated implementation complexity: ★★★★★ (5/5)
High-effort but high-impact. Demands cross-team collaboration, custom integrations, and a solid data strategy.
At the end of this exploration, it’s worth remembering: thoughtful implementation of advanced analytics is a natural evolution of a mature
E-learning strategy—it’s not the starting point.
Final Thoughts
Well, you now have a more or less clear (hopefully more than less!) vision of the analytics features your learning platform needs. So—what’s next?
The next step is elaboration, planning, and budgeting. At this stage, deep expertise in LMS development and LMS integration is required to handle the following tasks:
- Feasibility assessment
- Tech stack selection
- Timeline planning
- Budgeting.
The earlier you start communicating with the partner who will customize your LMS—whether it’s reporting modules, the entire system, or a solution built from scratch—the more concrete your planning will be.
At AnyforSoft, we’re ready to discuss your reporting requirements in E-learning right now to build analytics that will strengthen your organization not only in learning but also in achieving its broader strategic goals.
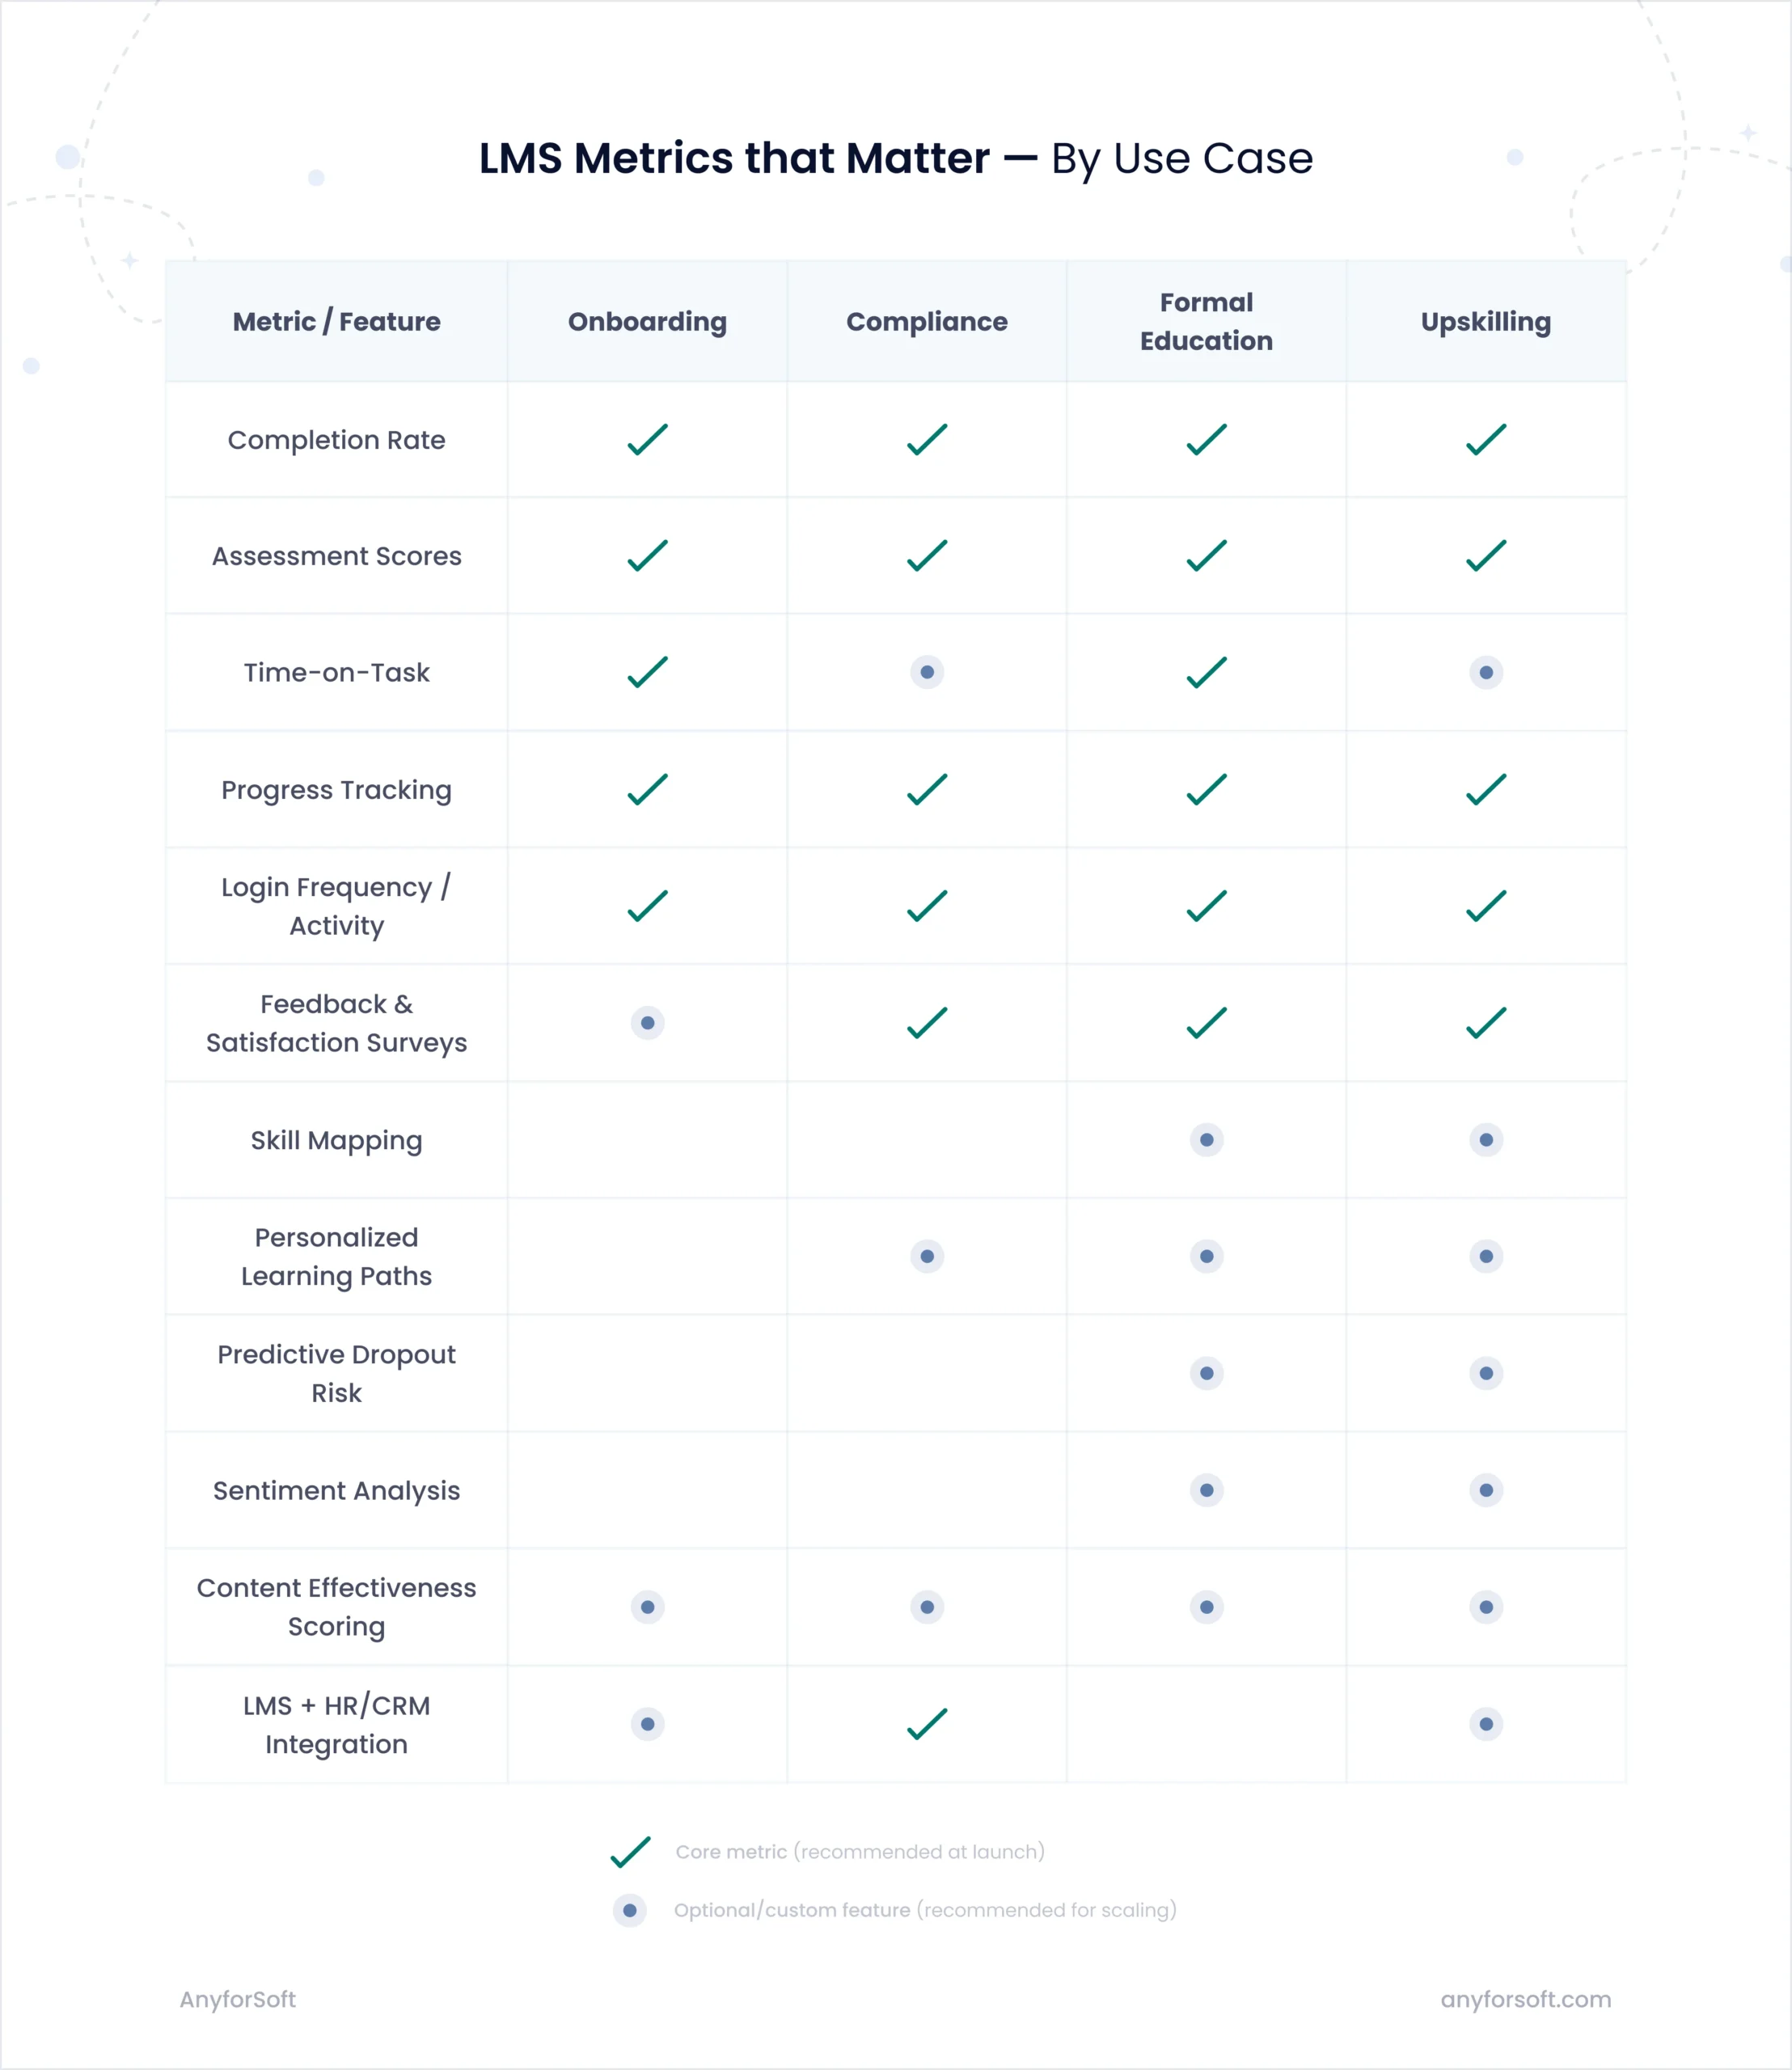
Use Case Checklist: What to Track for Different Goals
Not all learning goals require the same analytics setup.
Below is a strategic checklist of metrics aligned with four common LMS use cases.
Use it to evaluate what you need now—and what you may want to plan for as you scale.