Higher education institutions struggle with retention. Without real-time data, faculty can’t identify at-risk students until grades arrive. Admissions teams rely on intuition over evidence. Most campuses collect extensive data but fail to convert it into decisions that prevent dropouts.
Big data analytics addresses this gap by tracking student behavior and course performance across platforms. When students show risk patterns, instructors receive alerts. Program directors monitor cohort performance as semesters progress. Based on individual learning needs, course content adjusts automatically.
This article explores how big data analytics transforms education through cohort analytics, xAPI pipelines, instructor dashboards, and retention risk modeling. At the end, you’ll:
- Learn the trends reshaping big data analytics in the education sector
- See real use cases from institutions already using these systems
- Understand what it takes to implement an analytics infrastructure that delivers results
We’ve spent 14+ years building software for educational institutions, including Wittenborg University of Applied Sciences in the Netherlands and Imperial College Business School in the UK. We know what works because we’ve built it, tested it, and watched it improve real student outcomes – and we’re sharing those lessons here.
The Current State of Big Data Analytics in Higher Education
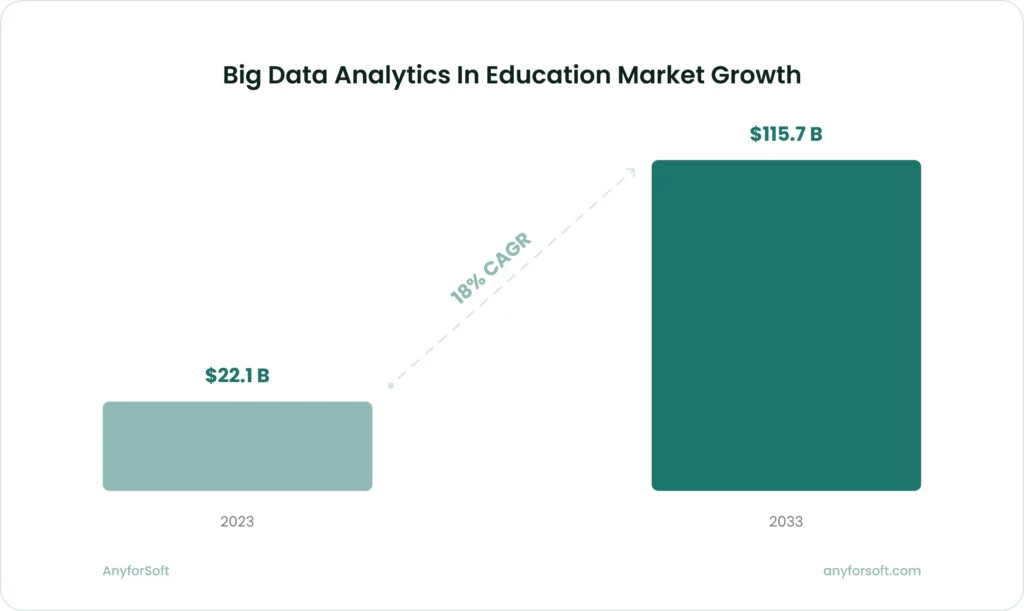
The big data analytics in the education market tells a story of rapid transformation. The global market is projected to reach $115.7 billion by 2033, up from $22.1 billion in 2023, growing at a compound annual growth rate (CAGR) of 18%. This isn’t just growth for growth’s sake. Institutions recognize that traditional gut-based decision-making no longer cuts it when enrollment is declining, budgets are tightening, and student expectations are rising.
The impact of big data analytics in education extends beyond market numbers. Research from the National Center for Education Statistics indicates universities implementing effective predictive analytics see retention rates increase between 5% and 15%. For context, Georgia State University reports graduating thousands of additional students annually since implementing predictive analytics, with the biggest gains among students from underserved backgrounds. Every one percent increase in retention generates $3.18 million in additional revenue for the institution.
But here’s what separates effective implementations from expensive experiments: focus. The institutions seeing results aren’t trying to analyze everything at once. They’re starting with specific problems – student retention, course completion, learning outcome prediction—and building analytics infrastructure that solves those problems first.
What’s driving adoption right now
Three forces are accelerating the adoption of big data analytics in higher education:
- Financial pressure and accountability. State funding models increasingly tie dollars to completion rates and graduate outcomes. Institutions need data to prove they’re delivering value and to identify where interventions will have the greatest impact.
- Technology maturation. Cloud platforms, learning record stores, and integration tools have evolved to the point where institutions can implement sophisticated analytics without building everything from scratch. The software segment captured over 57% of the big data analytics in the education market in 2023, reflecting this shift toward ready-to-deploy solutions.
- Student expectations. Today’s learners expect personalized experiences. They see Netflix recommend shows and Spotify create custom playlists. They wonder why their university can’t tell them which courses to take next or flag when they’re falling behind before it’s too late.
Drawing on our practical knowledge, we’ve seen institutions move from asking “Should we invest in analytics?” to “How quickly can we deploy this?” The question has shifted from if to how.
Key Trends Reshaping Big Data Analytics in the Education Sector
Big data analytics in education is changing rapidly. To avoid investing in infrastructure that becomes outdated within two years, institutions need to track current developments.
Real-time analytics replace batch processing
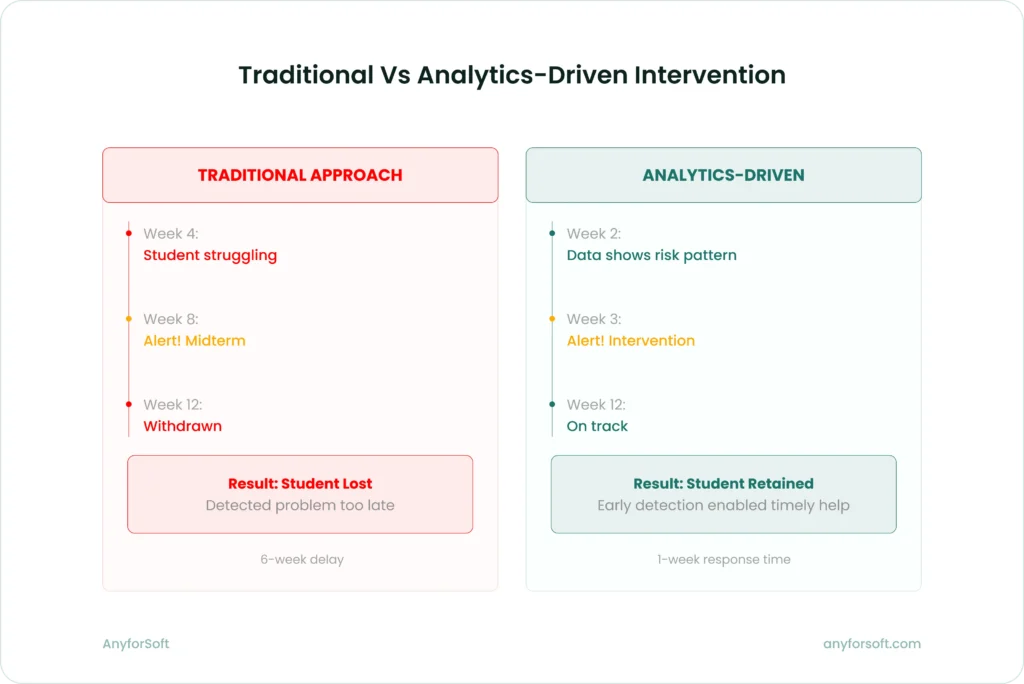
Traditional analytics systems run reports overnight or weekly. By the time faculty review the data, the intervention window has closed. Real-time analytics address this timing gap.
Instructors using real-time dashboards receive alerts when students miss assignments or when engagement drops below baseline. These patterns appear immediately, creating intervention opportunities while students remain enrolled.
Different technical architecture supports this shift. Rather than querying data warehouses once daily, systems stream data continuously and maintain updated views. The Experience API (xAPI) standardizes how learning activities get tracked across platforms.
xAPI becomes the standard for learning data collection
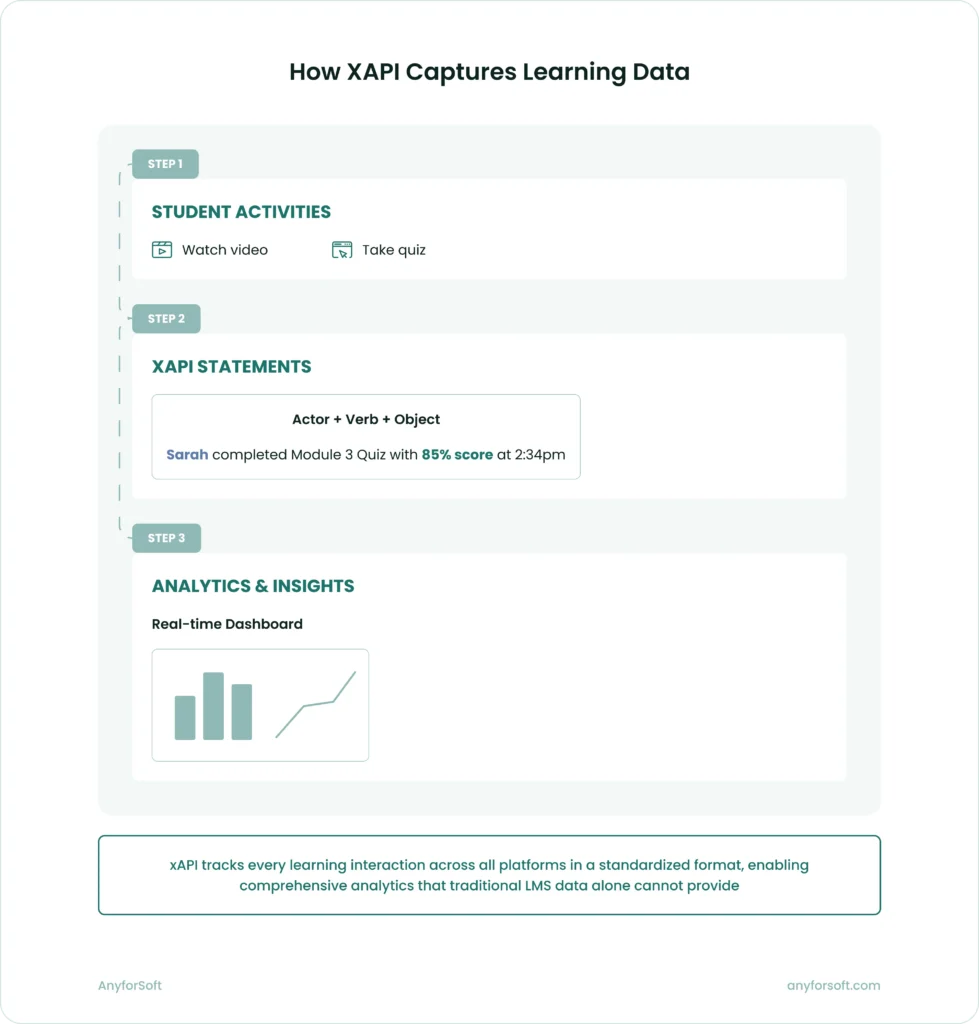
The Experience API created a common format for tracking learning experiences beyond LMS boundaries. When students watch lecture videos or complete simulations, xAPI captures those activities in standardized statements.
Learning happens across multiple systems. Students use content libraries and discussion forums alongside their LMS. Each system traditionally stored data in its own format. Cross-platform analysis was nearly impossible. xAPI addresses this fragmentation.
The pipeline has three stages:
- Activities generate statements: Actor + Verb + Object
- Statements flow to a learning record store (LRS)
- Analytics tools query the LRS for dashboards and models
Traditional LMS analytics capture only in-system activity. xAPI-powered analytics capture learning behavior across all platforms students use.
Explore: LMS vs SIS: What’s the Difference?
Cohort analytics move beyond basic demographics
Early cohort analysis segmented students by obvious characteristics: major, year, demographic background. Modern analytics examine behavioral patterns and learning trajectories instead.
Behavioral models reveal what demographics miss. Students who engage heavily with materials but struggle on assessments show learning approach issues, not motivation problems. Some learners start strong. They disengage midway through the semester, pointing to specific intervention windows. When certain instructional approaches work for some groups but fail for others, this informs course design decisions.
These behavioral cohorts matter more than demographic ones. Two students from identical backgrounds might need completely different support based on their learning patterns. At scale, analytics reveals these patterns, including which gamification elements drive engagement for specific student groups.
Most institutions start with demographic cohorts because the data is readily available. When they layer behavioral data on top, they discover patterns that demographics alone would never reveal. That’s where the real breakthroughs happen.
Predictive models get more granular and actionable
First-generation predictive models answered broad questions. Will this student graduate? Today’s models get specific: Is this student likely to drop this course in the next two weeks? Which intervention will most likely help?
More sophisticated modeling makes this granularity possible. Early systems used logistic regression on enrollment and grades. Modern systems train algorithms on hundreds of variables: attendance patterns, assignment submission timing, discussion forum participation, tutoring session attendance, financial aid status, course difficulty.
These models predict risk and recommend actions. A student shows warning signs. The system responds: schedule a meeting with the academic advisor, connect them with a peer mentor, provide supplemental tutoring in specific subjects, adjust their course load.
Georgia State University demonstrates this approach. Their predictive analytics system identifies specific obstacles when students show risk—financial holds, missed classes, failed prerequisite content. The system triggers appropriate interventions automatically.
AI integration creates adaptive learning pathways
Artificial intelligence extends analytics beyond description and prediction. Systems now prescribe specific actions rather than just reporting patterns or forecasting outcomes.
AI-powered systems analyze learning data to:
- Recommend personalized content based on knowledge gaps and learning preferences
- Adjust difficulty dynamically as students demonstrate mastery or struggle
- Identify optimal study schedules based on retention patterns
- Generate practice problems targeting specific misconceptions
Platforms like Carnegie Learning and Knewton demonstrate adaptive learning at scale. They combine content libraries with detailed performance tracking and machine learning models that identify effective learning sequences.
Implementation complexity remains the main challenge. Adaptive systems require content tagged with skill prerequisites and robust xAPI instrumentation. The algorithms must balance exploration—trying new approaches—with exploitation of proven methods.
Learn: How to Implement AI — Responsibly
Core Use Cases: Where Big Data in Education Delivers Real Impact
Understanding trends matters, but institutions need to know where to apply analytics first. These use cases represent areas where big data analytics in higher education consistently delivers measurable results.
Student retention: early alerts and targeted interventions
Student retention is the most mature and impactful application of big data analytics in higher education. The process works like this:
- Risk identification
Predictive models analyze dozens of variables to calculate retention risk scores for each student. These models look at:
- Academic performance metrics (grades, assignment completion, test scores).
- Engagement indicators (LMS logins, discussion participation, office hours attendance).
- Financial factors (aid status, payment deadlines, work study participation).
- Support service utilization (tutoring, counseling, career services).
- Historical patterns from similar student cohorts.
- Alert generation
When a student’s risk score crosses a threshold, the system generates alerts for appropriate staff members. The alerts include context – not just “this student is at risk” but “this student is at risk because of declining assignment submission rates and missed tutoring sessions.”
- Intervention tracking
The system logs which interventions happen and tracks their effectiveness. Over time, this creates a feedback loop that improves both the predictive models and the intervention strategies.
Universities implementing this approach see tangible results. Studies show retention rates improve between 5% and 15% with effective early alert systems. The financial impact is substantial—institutions avoid lost tuition revenue and improve their completion metrics.
Based on our experience working with higher education institutions, the technical infrastructure matters less than the organizational commitment. Schools succeed when they staff their alert systems appropriately, train advisors to act on alerts quickly, and continuously refine their intervention strategies.
Cohort performance analysis for program improvement
Program directors need to answer questions like: Why does this cohort struggle more than previous ones? Which courses create bottlenecks? Where should we invest additional support?
Cohort analytics provides answers by comparing performance across student groups over time. The analysis might reveal:
- Specific courses where failure rates spike for certain cohorts.
- Topics where most students struggle regardless of background.
- Correlations between early-semester engagement and final grades.
- Effectiveness of different instructional approaches.
The key is granularity. Aggregate statistics hide important patterns. A program with an overall 85% pass rate might have a 60% pass rate for evening students or online learners. Without cohort analysis, these disparities remain invisible.
Effective cohort analysis combines quantitative data with qualitative context. The numbers show what’s happening. Interviews with students and faculty explain why. Together, they guide improvement decisions that actually address root causes.
Instructor dashboards for real-time course management
Faculty face an impossible challenge: understand how 50, 100, or 200 students are doing in their course and intervene when someone needs help. Without data, this requires superhuman observation skills and luck.
Instructor dashboards solve this by surfacing actionable insights about course performance:
- Individual student views show engagement patterns, assignment completion, and comparison to peers. Instructors quickly identify students who need check-ins.
- Cohort views highlight which concepts confused the class, which assignments took longer than expected, and where students need additional support.
- Intervention recommendations suggest specific actions based on patterns in the data. If a student’s engagement dropped suddenly, the system might recommend a wellness check. If multiple students struggled with the same concept, it might suggest additional review materials.
The best dashboards prioritize simplicity. Faculty don’t want to learn complex analytics tools. They want clear signals about where to focus their limited time. This is where customizable learning management systems prove their value by adapting to institutional workflows rather than forcing faculty into rigid templates.
Our work with High Pass Education demonstrates this principle at the course level—we built custom assessment analytics that provided learners with detailed performance breakdowns and gave administrators visibility into common struggle points. The platform moved beyond basic pass/fail metrics to surface patterns in time management, question difficulty, and knowledge gaps.
Learning pathway optimization through experience data
xAPI pipelines enable a powerful but underutilized application: understanding which learning sequences work best for different types of students.
Traditional course design follows intuition – instructors present material in the order that makes sense to them. Analytics-driven design tests that intuition against evidence.
Here’s how it works:
#1. xAPI captures detailed interaction data as students move through course materials
#2. Analytics identify patterns: Which students who watched the lecture video before attempting practice problems performed better than those who did the reverse?
#3. The system recommends optimal sequences based on evidence from previous cohorts
#4. Instructors can A/B test different approaches and measure results
This gets more sophisticated with larger datasets. Machine learning models can identify non-obvious patterns – maybe students who struggle initially benefit from more scaffolding, while strong students do better with less structure. The system can adapt pathways based on these patterns.
The challenge is instrumentation. For this to work, every meaningful learning interaction needs xAPI tracking. That requires investment in content development and platform integration.
Predictive analytics for resource allocation
Institutions make resource decisions – hiring faculty, scheduling rooms, allocating tutoring support – based on historical patterns and educated guesses. Predictive analytics replaces guesses with evidence.
The applications span multiple domains:
- Course scheduling. Models predict enrollment demand by course, section, and time slot based on student registration patterns, degree requirements, and historical data. This helps avoid both overcrowded sections and underutilized classrooms.
- Support service staffing. Analytics predict when students will need tutoring, counseling, or technical support based on academic calendar patterns and real-time demand signals.
- Financial planning. Retention models forecast likely revenue based on current student risk profiles, allowing for more accurate budgeting.
- Space utilization. Occupancy data combined with class schedules identifies underutilized spaces and optimization opportunities.
The key is connecting analytics outputs to actual decision processes. A beautiful dashboard that nobody uses for resource planning adds no value. Effective implementations embed analytics directly into planning workflows.
Technical Infrastructure: What It Takes to Implement Big Data in Education
Understanding use cases is one thing. Building the infrastructure to support them is another. Here’s what the technical architecture looks like for institutions successfully leveraging big data in education.
The core components
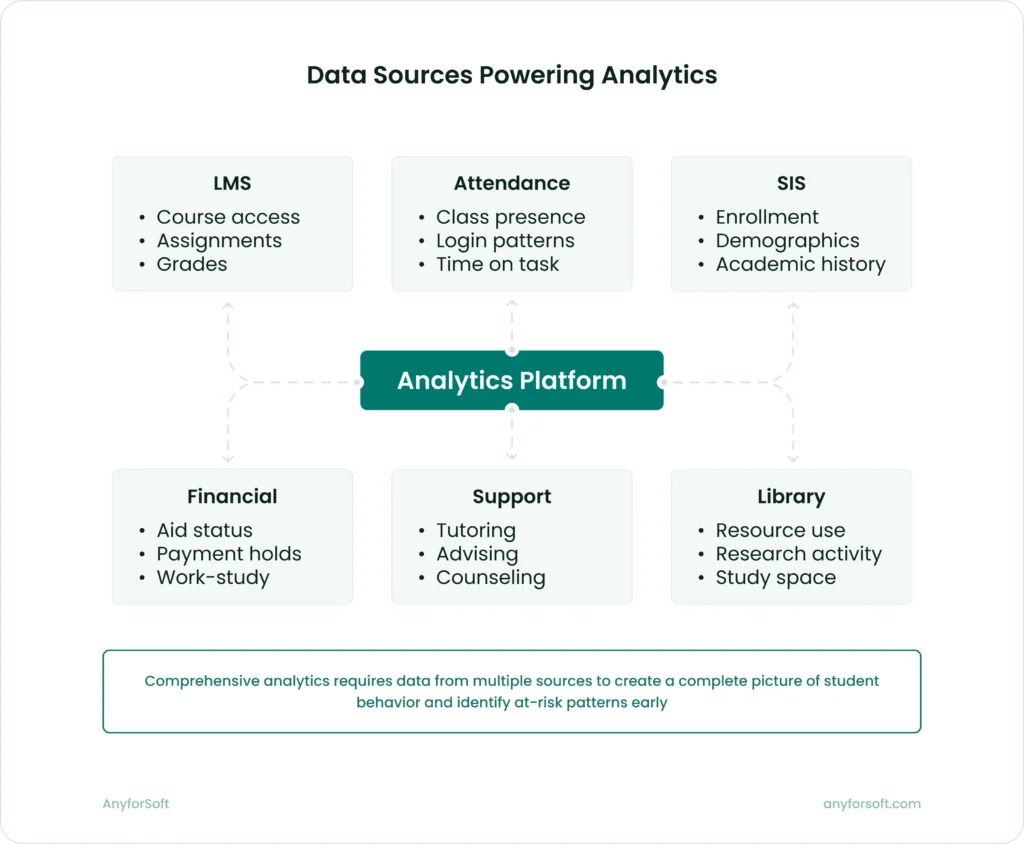
- Data collection layer
This includes learning management systems, student information systems, assessment platforms, attendance tracking, library systems, and any other source of student activity data needed to use big data analytics for education effectively. The key is standardizing how data flows out of these systems, typically through APIs or xAPI implementations.
- Integration middleware
Data from disparate systems needs normalization and transformation before analysis. Integration platforms connect sources, handle authentication, manage data flow, and ensure consistent formatting.
- Learning record store (LRS)
For institutions using xAPI, the LRS serves as the central repository for learning activity data. It stores xAPI statements from multiple sources and provides query capabilities for analytics tools.
- Data warehouse or data lake
Aggregated data lands in a centralized repository optimized for analytical queries. Modern implementations often use data lakehouse architectures that combine the flexibility of data lakes with the performance of data warehouses.
- Analytics engine
This layer runs the actual analysis – generating reports, training predictive models, calculating risk scores, and powering dashboards. Tools range from business intelligence platforms like Tableau or Power BI to custom machine learning pipelines using Python or R.
- Presentation layer
Dashboards, reports, and alerts that deliver insights to end users – faculty, advisors, administrators, and sometimes students themselves.
Common implementation challenges
Building this infrastructure presents several challenges that institutions consistently face:
- Data quality and consistency. Learning systems accumulate years of data with inconsistent formatting, missing values, and conflicting definitions. Before meaningful analysis happens, institutions must clean and normalize their data. This often takes longer than anticipated.
- Privacy and compliance. Student data is sensitive and regulated. FERPA compliance, ethical use policies, and data security requirements constrain what data can be collected, stored, and analyzed. Institutions need clear governance frameworks before deploying analytics systems.
- Cross-system integration. Most higher education institutions run dozens of separate systems that were never designed to talk to each other. Building integration pipelines requires significant technical effort and ongoing maintenance as systems upgrade.
- Organizational readiness. Technology is the easy part. The hard part is training faculty to use dashboards, establishing workflows for responding to alerts, and creating cultures where data-driven decision-making actually happens.
- Scalability. Systems that work fine with 5,000 students may struggle with 50,000. Real-time analytics especially require infrastructure that can handle high data volumes with low latency.
We’ve seen firsthand that successful implementation starts small. Pick one use case, build the infrastructure to support it, prove the value, and expand from there. Institutions that try to build comprehensive analytics platforms all at once usually struggle.
The role of cloud platforms
Cloud-based data analytics infrastructure has become the default for most institutions. The advantages are compelling:
- Scalability without upfront hardware investment.
- Managed services that reduce IT maintenance burden.
- Integration with modern analytics tools and machine learning platforms.
- Better disaster recovery and data backup capabilities.
Cloud platforms like AWS, Google Cloud, and Azure provide purpose-built services for educational analytics: managed data warehouses, machine learning pipelines, API gateways, and visualization tools. This allows institutions to focus on deriving insights rather than managing infrastructure. Learn more about cloud-based infrastructure for educational analytics and how it empowers modern learning environments.
The trade-offs involve ongoing costs and dependence on cloud providers. Some institutions, particularly large public universities, maintain hybrid approaches with on-premises data warehouses feeding cloud analytics tools.
Importance of Data in Education: Real-World Implementation Examples
Theory and architecture diagrams matter, but concrete examples show what’s actually possible. Here are implementation patterns from institutions using big data analytics effectively.
Adaptive learning platforms
Several platforms demonstrate how xAPI pipelines and adaptive algorithms work together. The student interacts with course content – videos, readings, practice problems. Each interaction generates xAPI statements that flow to the LRS. The adaptive engine analyzes these statements in real time, identifying knowledge gaps and adjusting the learning path accordingly.
If a student demonstrates mastery of foundational concepts, the system skips basic review and presents more challenging material. If the student struggles, it provides additional practice and alternative explanations before moving forward.
The technical challenge is response latency. For truly adaptive experiences, the system must analyze performance and adjust content within seconds of interaction. This requires efficient data pipelines and optimized algorithms.
Retention risk dashboards
Multiple universities have implemented early alert systems with varying approaches. The common pattern involves:
- Nightly batch processes that pull data from student information systems, learning management systems, and other sources.
- Machine learning models that calculate risk scores based on current and historical patterns.
- Dashboards that surface high-risk students to advisors with context about specific risk factors.
- Case management systems that track interventions and outcomes.
The systems differ in sophistication. Simple implementations use basic logistic regression on grades and attendance. Advanced implementations use ensemble models incorporating hundreds of variables and updated in real time.
What separates successful implementations from failed ones isn’t algorithm sophistication. It’s organizational integration. Schools succeed when advisors trust the alerts, have the capacity to respond, and see their interventions improve outcomes.
Cross-platform learning analytics
Some institutions have built comprehensive learning analytics by instrumenting multiple systems with xAPI. A typical architecture includes:
- LMS generating xAPI statements for course activities.
- Video platform tracking viewing behavior and interactions.
- Discussion forum capturing participation patterns.
- The library system recording resource utilization.
- All statements flowing to a central LRS.
This creates a complete picture of student learning behavior across platforms. Analytics can answer questions like: Do students who watch lecture videos before class participate more actively in discussions? Do library resource usage patterns correlate with assignment performance?
The implementation requires significant integration work – each platform needs xAPI configuration, authentication setup, and ongoing maintenance. The payoff is rich, cross-platform insights that single-system analytics can’t provide.
Discover: LMS Requirements: The Hands-On Checklist to Use Today
Getting Started: Practical Steps for Implementation
If you’re convinced of the value but unsure where to begin, here’s a practical roadmap:
- Define specific goals. Don’t start with “we need better analytics.” Start with “we want to improve freshman retention by 5%” or “we need instructors to identify struggling students earlier.” Specific goals drive focused implementation.
- Audit your data landscape. Catalog what data you’re currently collecting, where it lives, and how accessible it is. Identify gaps between what you have and what you need for your goals.
- Start with a pilot. Choose one program, one cohort, or one use case. Build the infrastructure to support it. Prove the value. Use that success to justify broader investment.
- Invest in data governance. Establish clear policies around data collection, storage, analysis, and use. Address privacy concerns proactively. Create processes for ensuring data quality.
- Train end users. The best analytics system fails if nobody uses it. Budget time and resources for training faculty, advisors, and administrators. Make sure they understand not just how to use the tools but why they matter.
- Plan for iteration. Your first implementation won’t be perfect. Build feedback loops that capture user input and outcome data. Use these insights to refine models, adjust dashboards, and improve processes continuously.
- Consider partnering with experienced teams. Building a robust analytics infrastructure requires expertise in data engineering, machine learning, user experience design, and educational domain knowledge.
Conclusion
Big data and education has moved from experimental to essential in higher education. Institutions with the strongest results share a pattern. They pick one specific problem and build infrastructure to solve it. Based on proven impact, they expand to other areas.
The technical components exist and are increasingly accessible. xAPI pipelines track learning across platforms. Learning record stores consolidate this activity data, while predictive models calculate risk scores and dashboards surface actionable patterns. Institutions of varying sizes can now access these tools without massive infrastructure investment.
Implementation success depends on people, not technology. Analytics systems fail when leadership treats them as IT projects. They succeed when:
- Advisors act on alerts within days rather than weeks
- Faculty use dashboards to identify struggling students early
- Administrators respond to insights with resource allocation decisions
- Cross-departmental teams coordinate interventions based on shared data
Analytics technology keeps changing. Cloud platforms have eliminated infrastructure barriers for smaller institutions. AI now enables personalization at scales that weren’t possible five years ago. Integration standards allow previously incompatible systems to share data and coordinate interventions.
For institutions ready to move forward, start by picking a specific retention problem or enrollment challenge. Build the analytics infrastructure to address it, then prove the impact with one cohort or program. Expand to other areas based on demonstrated results.
The technology exists. Your institution can implement analytics now or wait until competitors force the issue.
We’ve built analytics platforms for universities like Wittenborg and Imperial College Business School. Contact us to accelerate implementation and start improving retention within months.