The story of Drupal 8 began back in 2011. Since then, thousands of web developers around the world have been looking forward to the release of a brand-new version of this well-known content management system. In November 2015, Drupal 8 was released and developers were able to explore its features to build new or improve the existing Drupal sites.
The 8th Drupal version kept and significantly improved all the best features from the previous versions. This user-friendly tool provides new opportunities for data structuring, website customization, and content presentation. Besides that, it opens new mobile development and multilingual accessibility horizons. Powered by Symfony2, it is a great choice for web development.
However, writing excellent Drupal code when providing custom Drupal development services is still immensely difficult, and getting it perfect the first time is almost impossible. You can save your project from most potential issues if you work independently. But if you are working with a large enterprise solution built by many Drupal developers over the years, you need to be an expert in Drupal 8 debugging techniques. Take a look at the best ways to improve your Drupal code and use this article as your Drupal debugging handbook!

#1: Disable Cache in Drupal Settings
Drupal 8 has expanded its functionality due to volumetric caching (rendered Twig templates and blocks) and Varnish as caching server for excellent performance. With every change we make, we run the risk of being forced to rebuild the Drupal site cache from scratch. Solutions? We know three ways to address Drupal 8 debug effectively:
1) Clear Cache
It will allow you to visualize changes and progress. You can clear the cache manually every time by going along this path: Configuration – Performance – ‘Clear all caches’.
2) Use Drupal Twig Debug
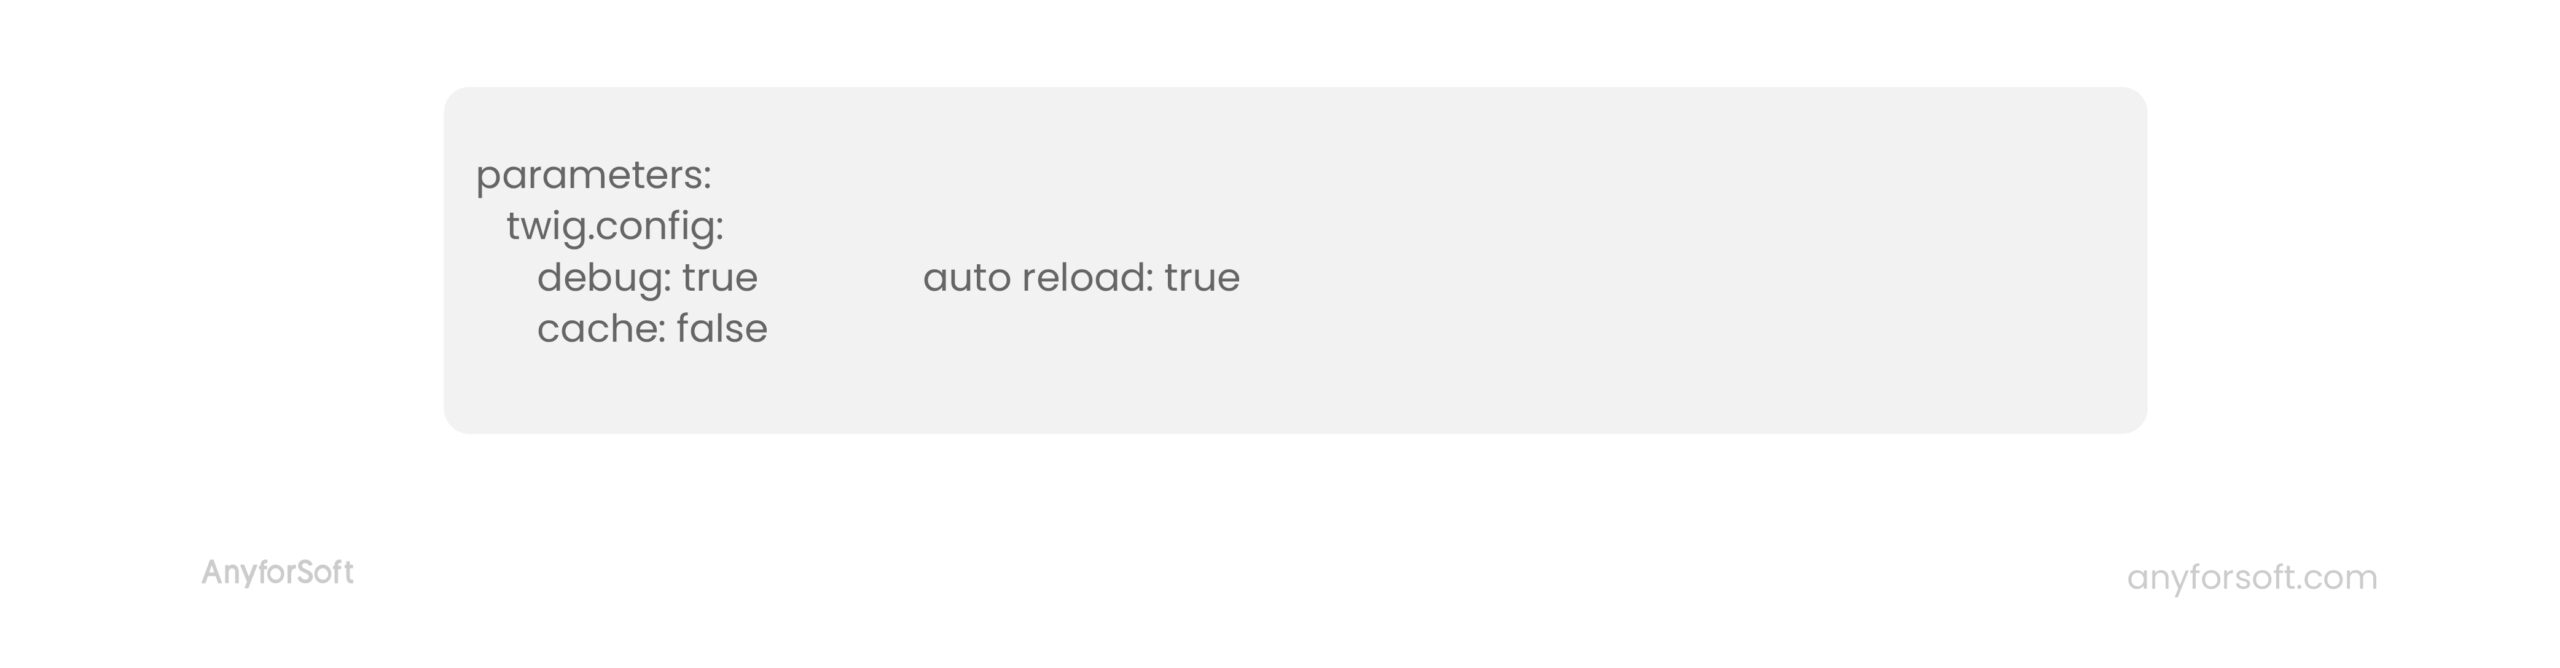
Drupal 8 is enriched with an out-of-the-mode Twig debugging feature. You can enable Twig debugging to improve your code. Add a few lines of the following code either in the sites/default/service or development.service file.
parameters:
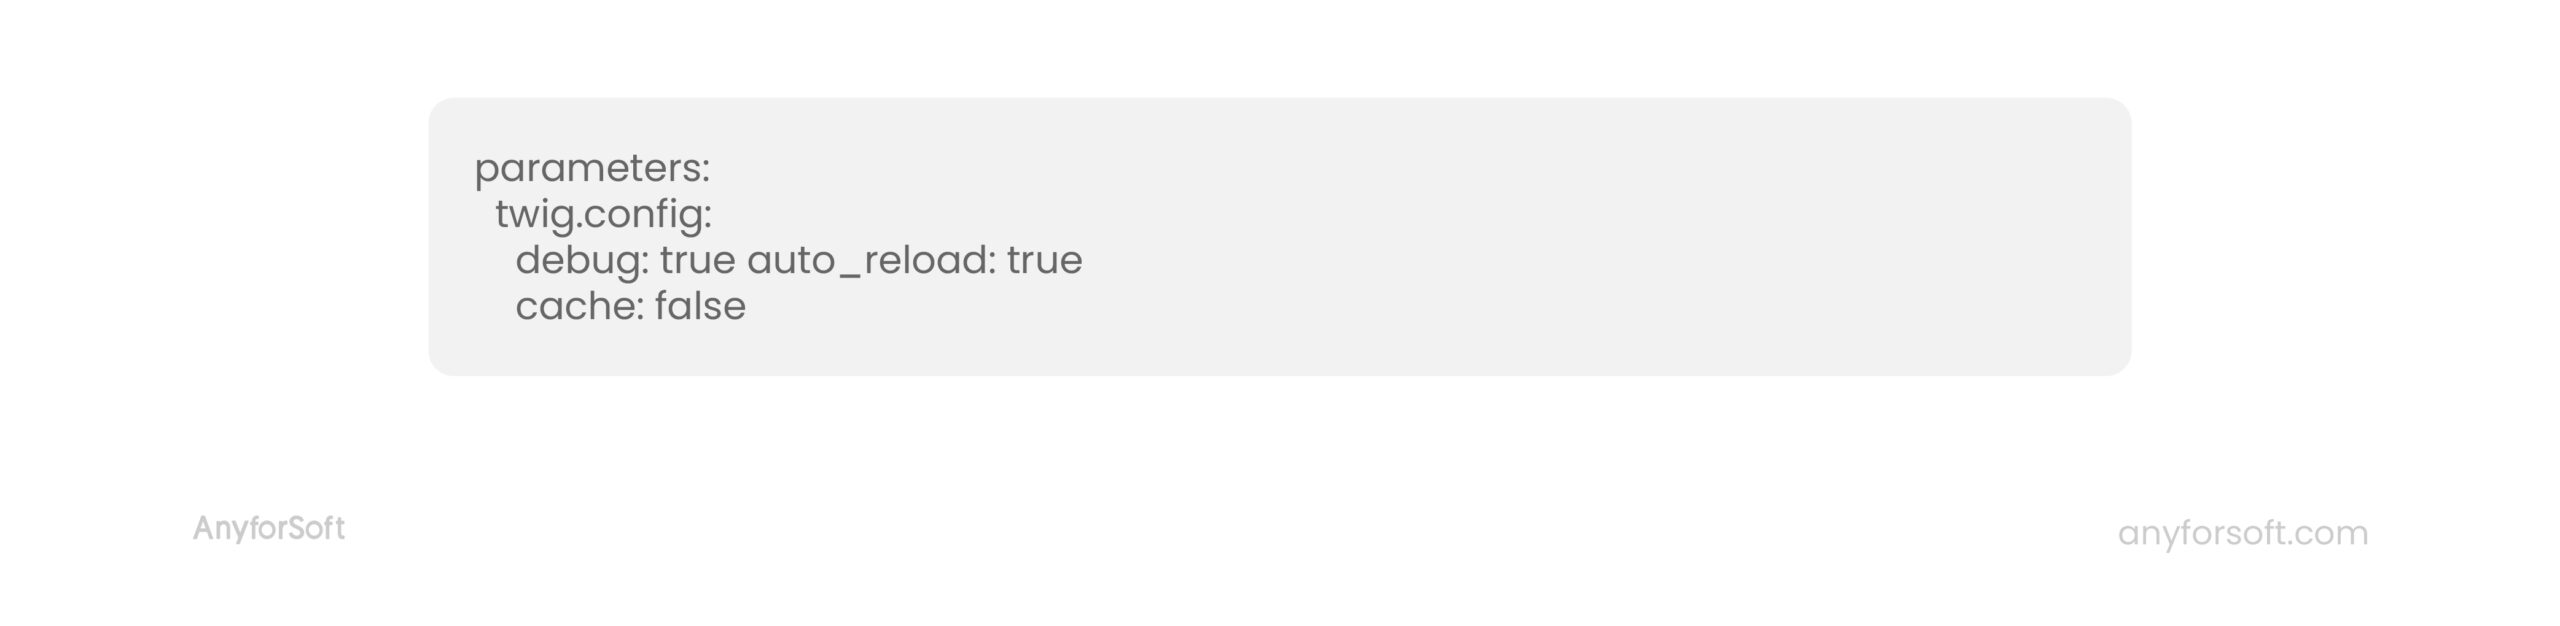
Why is Drupal Twig Debug Effective?
- search refinement (you can quickly determine which part of your HTML code was written in which Twig templates, by HTM comments)
- easy to find matching sentence Twig templates, and you can easily override them
- true parameter debug, which turns on the Twig debugging process and starts displaying the used Twig templates along with their paths
3) Drupal 8 Local Development Setup
Step 1. Copy the file /sites/example.settings.local.php to file /sites/default/settings.local.php
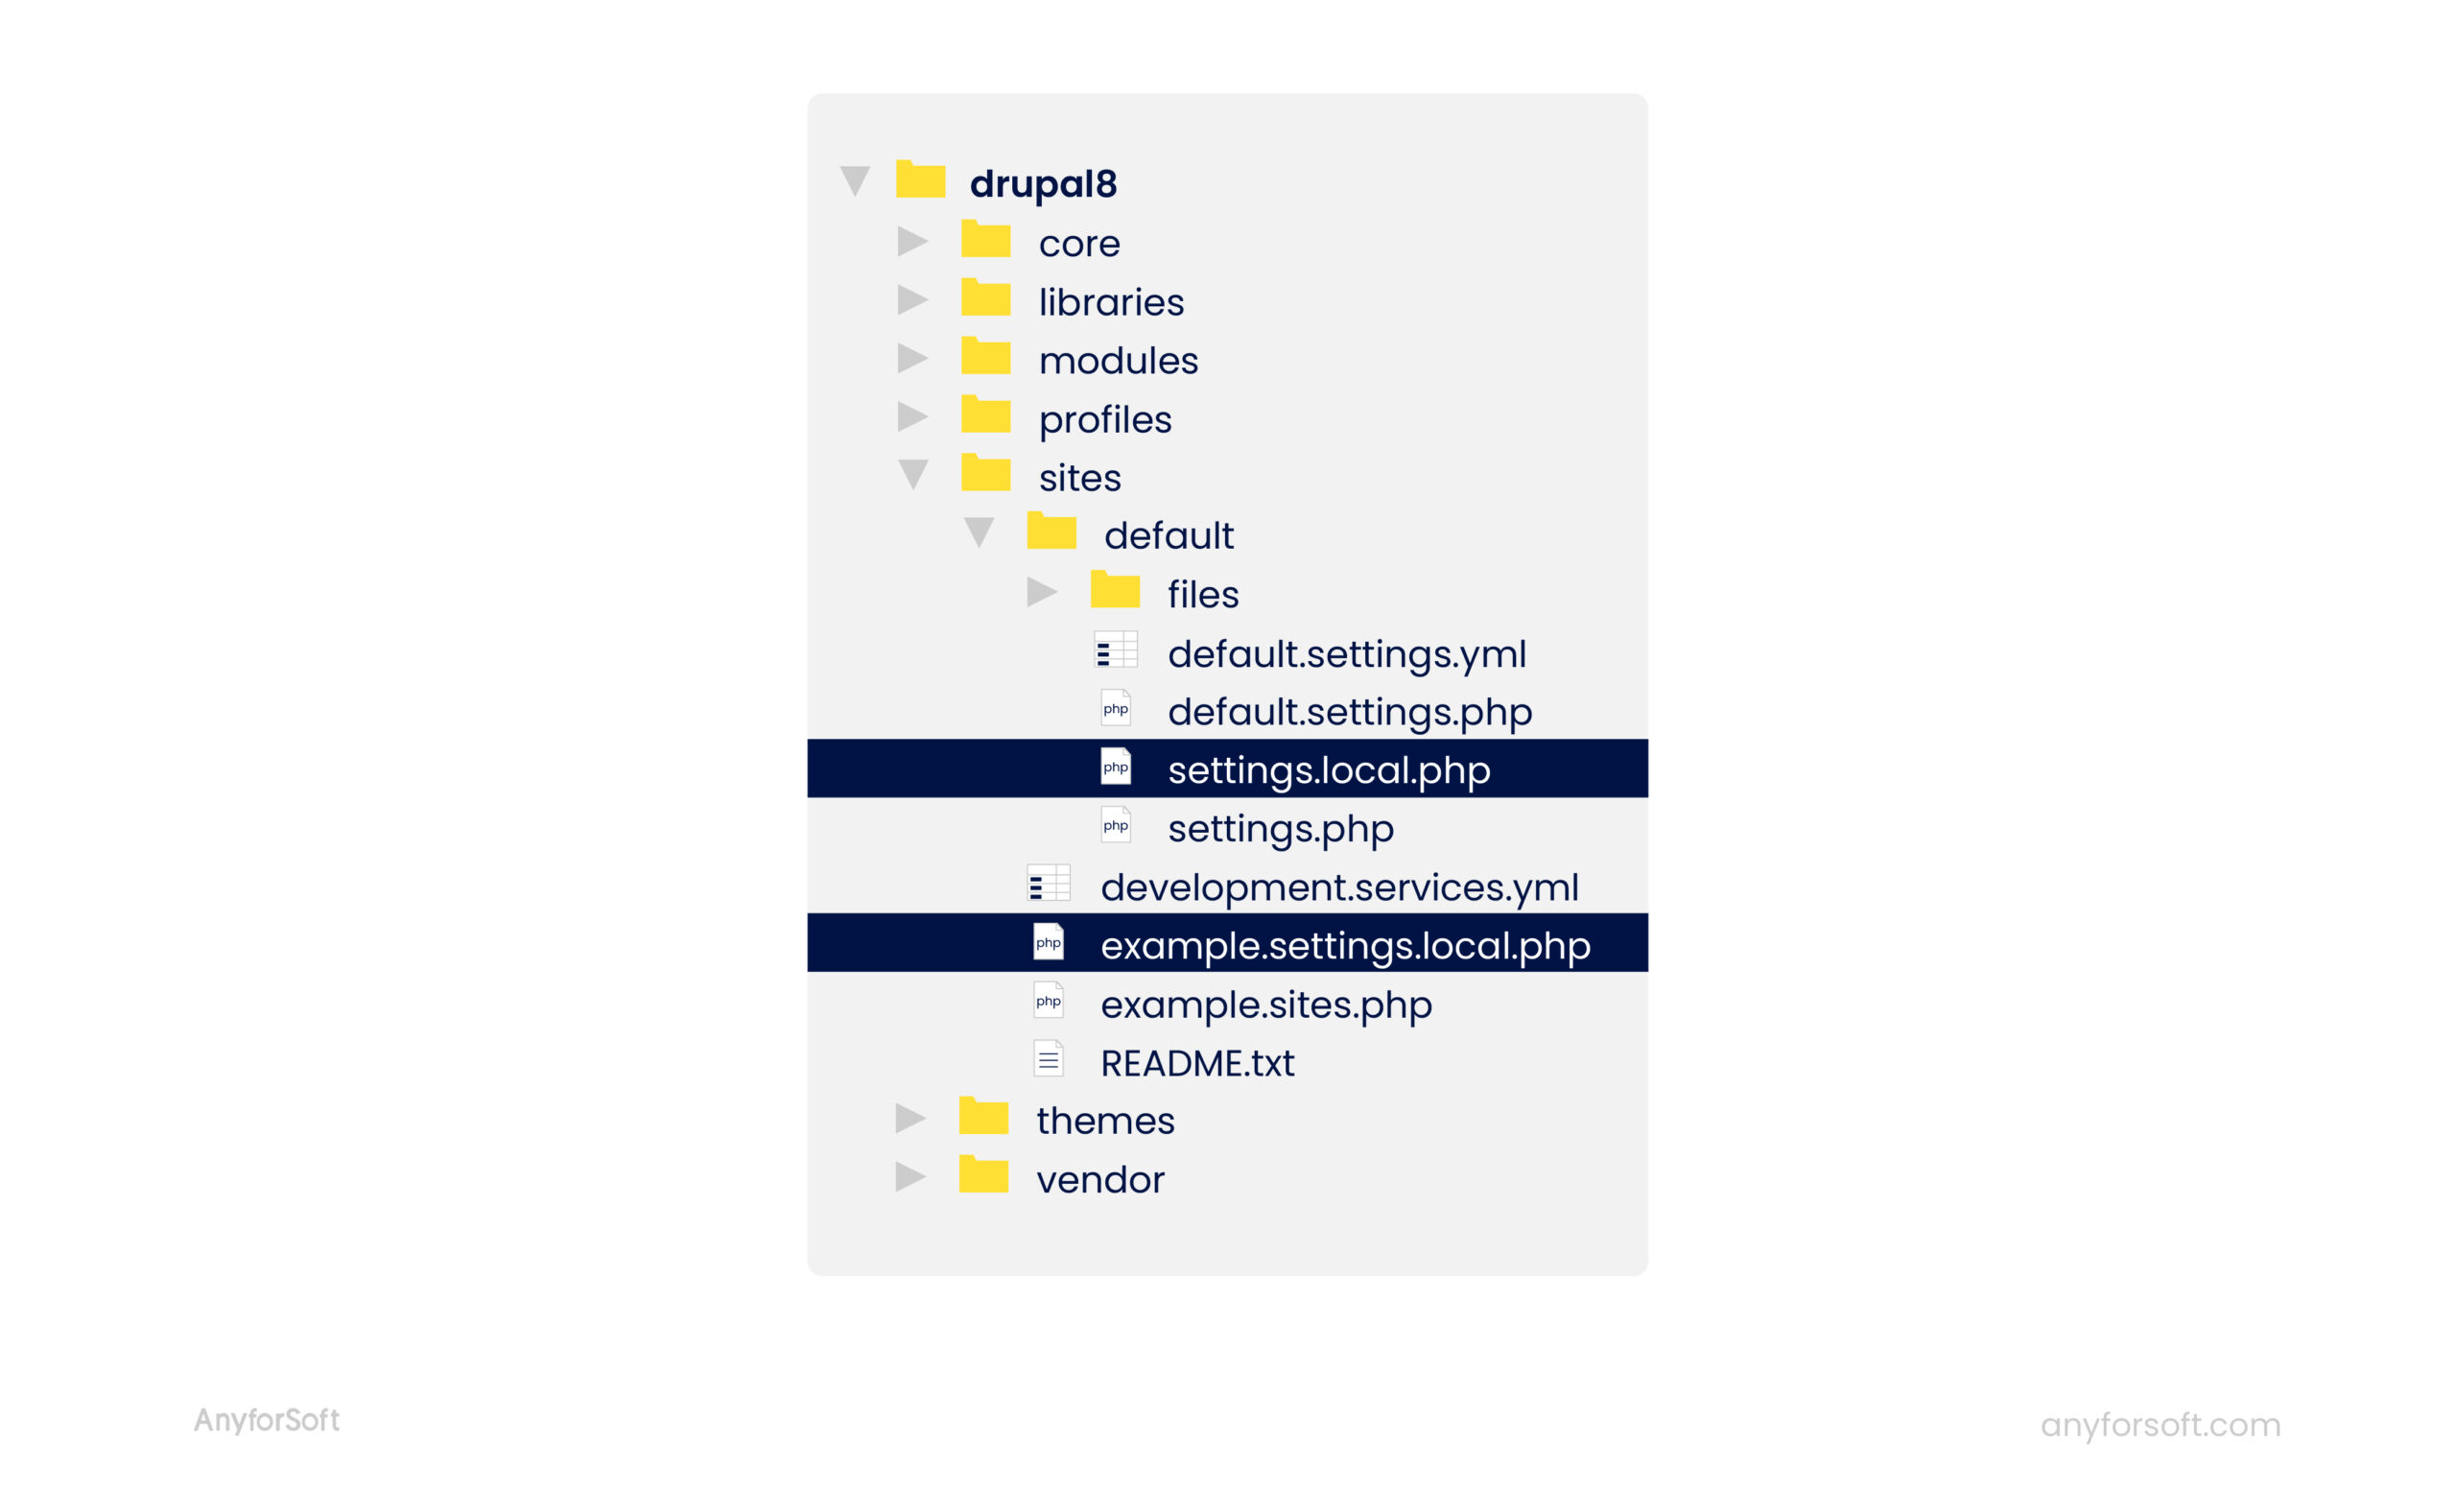
This file already has the necessary settings.
Step 2. In the file settings.php uncomment the following lines, this will include created settings.local.php:
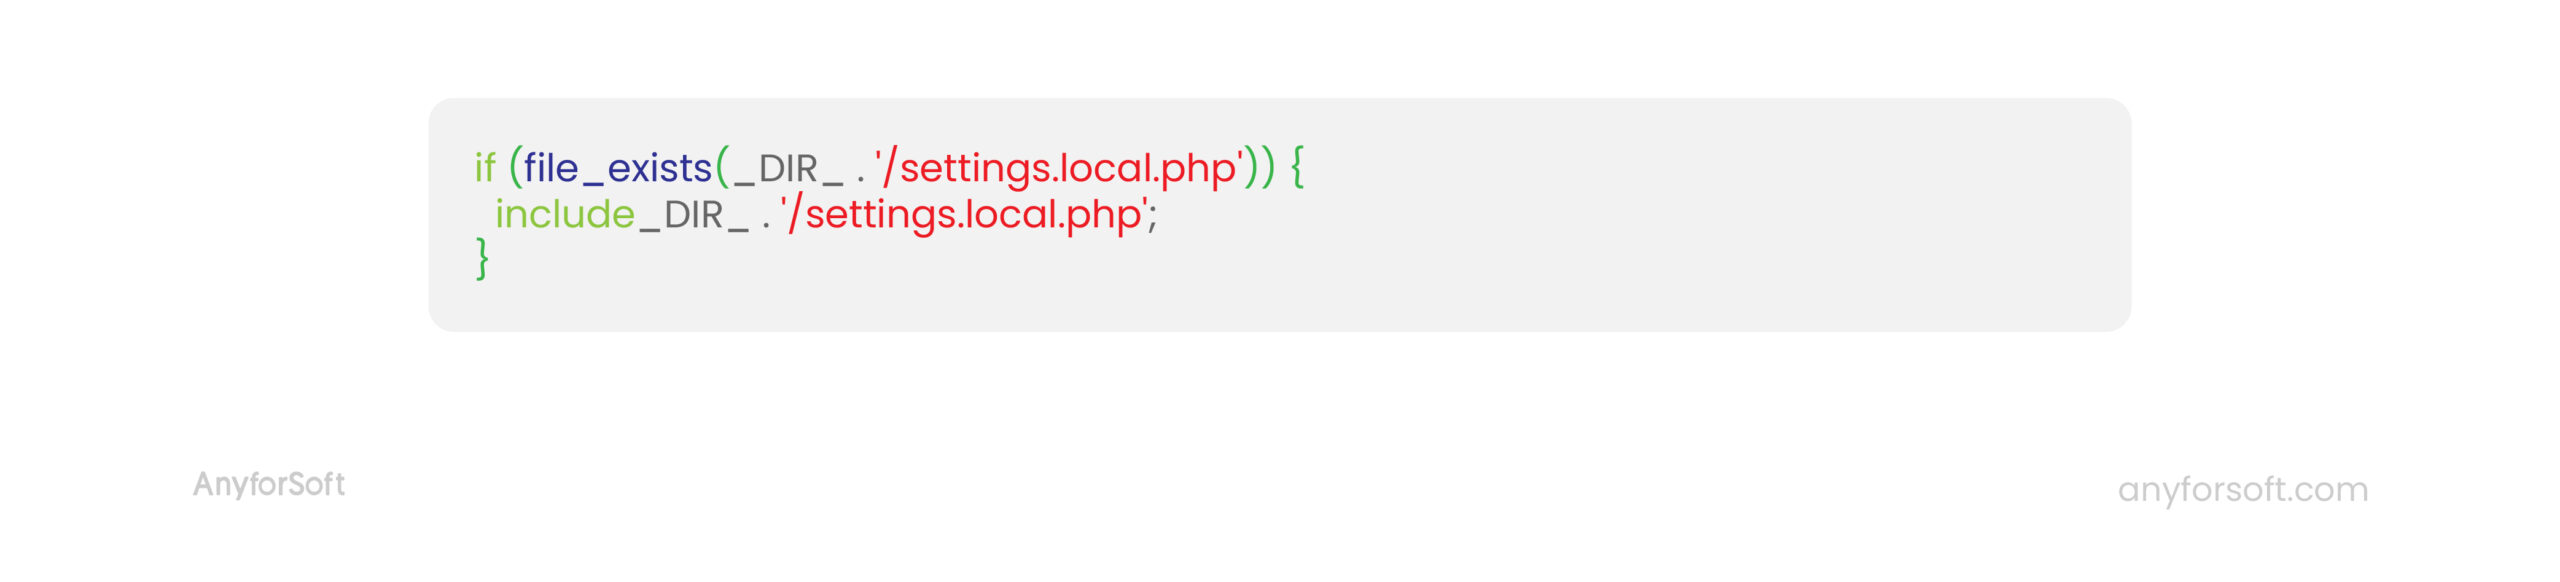
Step 3. Check that this line is uncommented in settings.local.php:
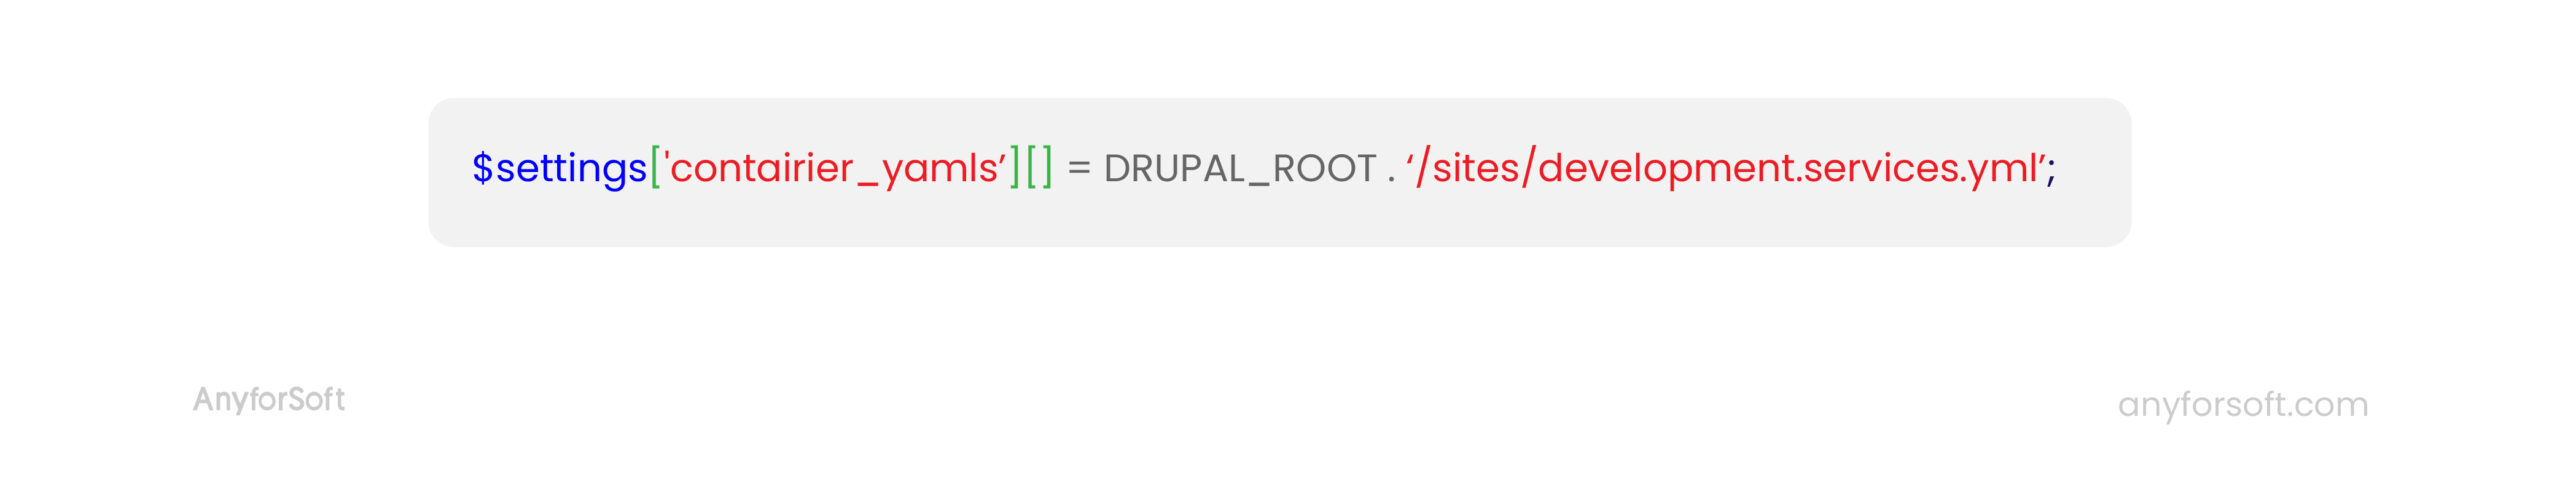
The development.services.yml file has already been created, you only need to include it.
Step 4. You also need to check that in settings.local.php CSS and Javascript aggregation are disabled:
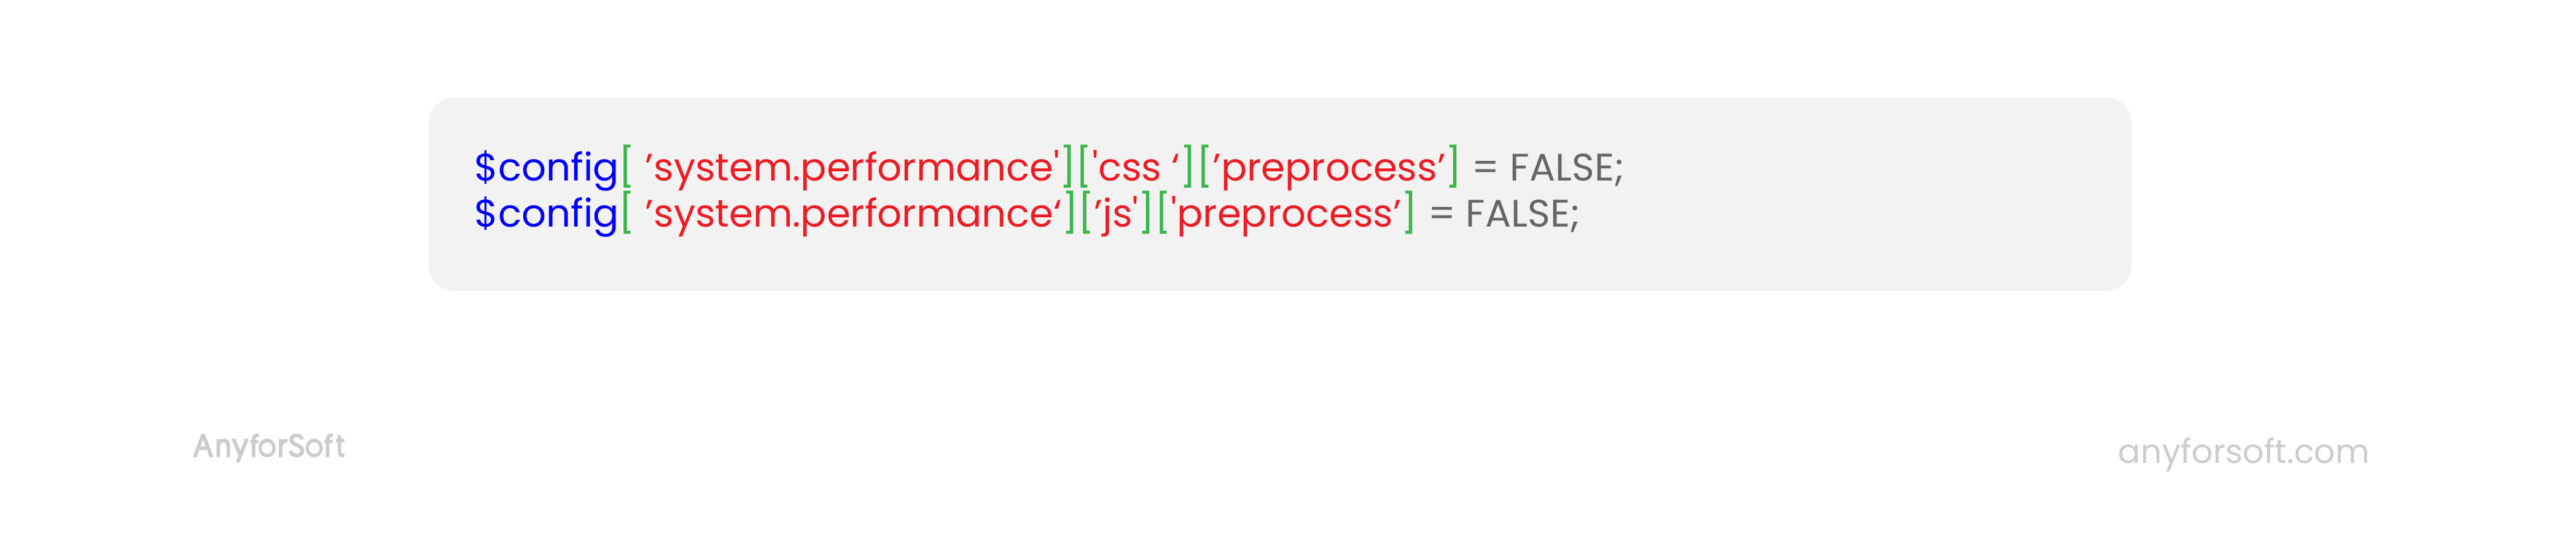
Step 5. You need to disable caching of rendered HTML and the cache of the Dynamic Pages module:

Step 6. To prevent Drupal 8 from picking up tests from modules, you need to change the value of this setting to FALSE:

Step 7. You need to add the following lines to /sites/development.services. yml:
As a result, development.services.yml should look like this:

Step 8. After that, you need to clear the cache, which can be done via Drush:
drush cr
In case this method wasn’t helpful enough, follow the next Drupal 8 debugging piece of advice.
#2. Connect the Devel Module
The Devel module in Drupal 8 is a quick and easy way to start debugging.
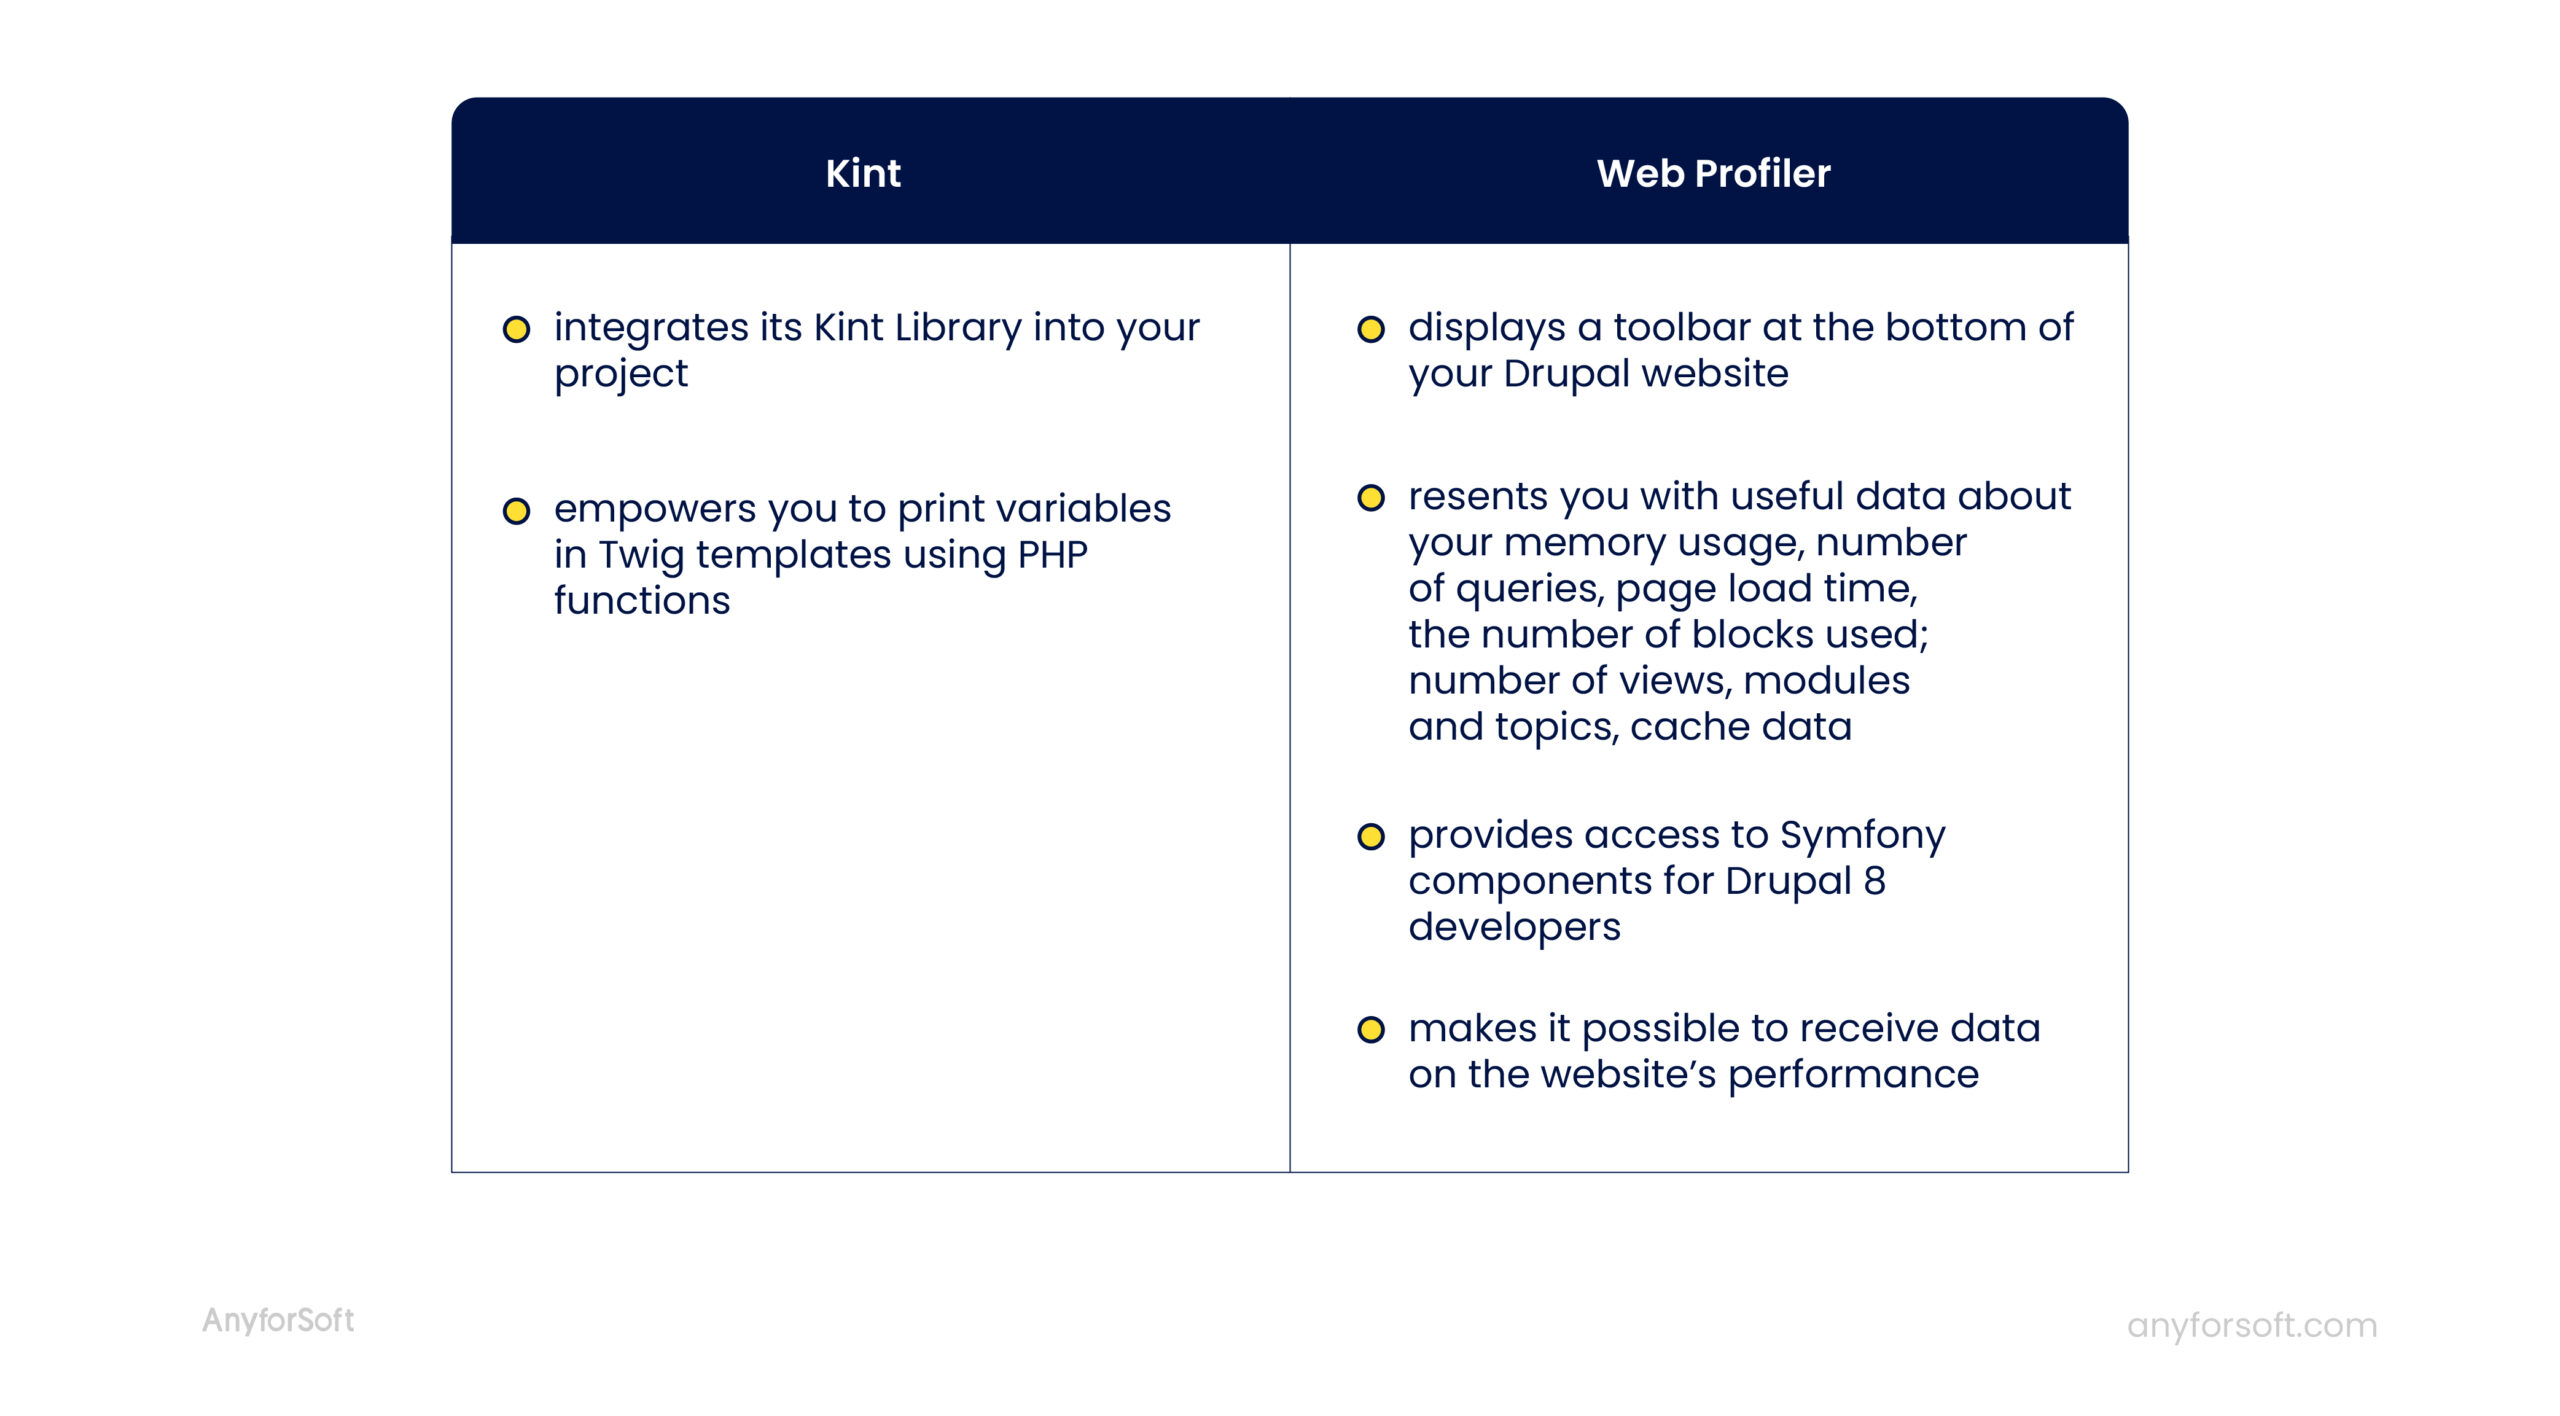
Drupal Devel module consists of two submodules: Kint and Drupal 8 Web Profiler. Here are the main functions of Kint and Drupal 8 web profiler:
#3. Use the Drupal Console
We don’t forget about the powerful Drupal CLI, which allows you to:
- create code for creating Drupal themes and modules
- interact with the Drupal installation
- debug code in your Drupal 8 web project
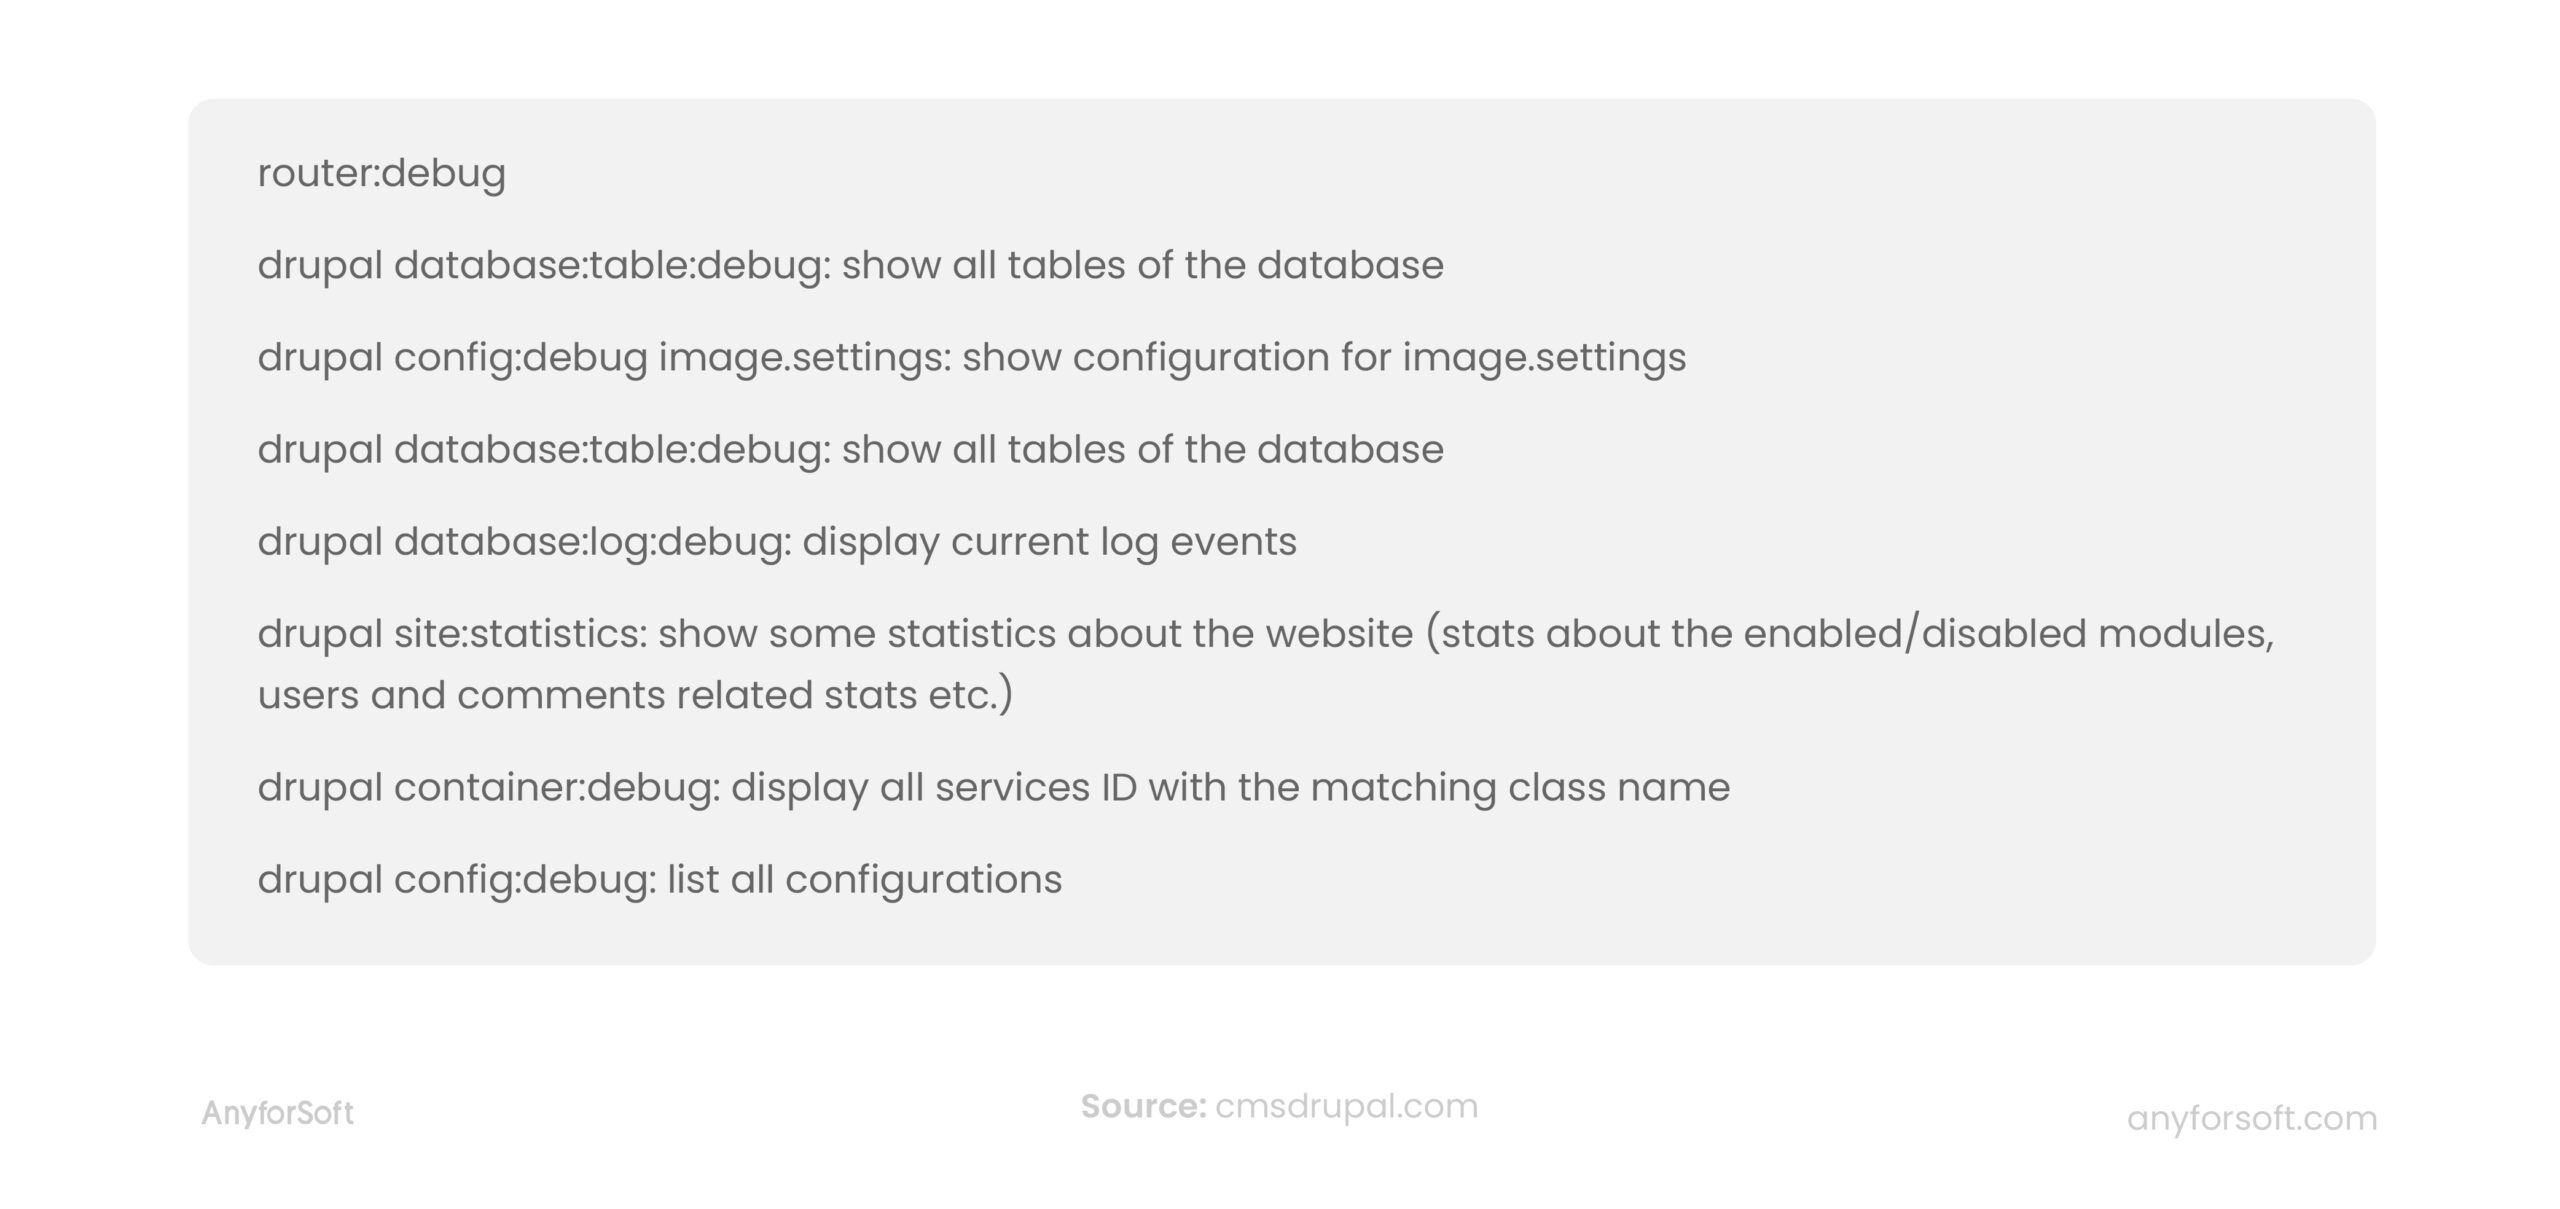
Thanks to the power of the Symfony Console and its third-party components, the Drupal Console provides you with a vast range of Drupal debugging commands.
By the way, Drupal Console allows to use of any command with the term “debugging,” but we recommend using the following parameters.
#4. Use PHPStorm for Drupal Debugging
If none of the above methods of Drupal debugging is suitable for you, you can use a paid commercial PHP extension PHPStorm IDE for your Drupal project. It integrates perfectly with the Drupal and Xdebug code base.
Xdebug is a more complex, advanced debugging technique than the slightly simpler, faster, and easier-to-use Drupal development module. It is one of the best Drupal 8 debugging ways that allows you to add a breakpoint to your PHP code and perform systematic actions as the Drupal query is executed.
There are two common useful PHP functions which are often used to print variables: print_r() and var_dump(). However, with Xdebug, you also get easy access to your print variables. You can visualize which ones are available at a particular time. You need to figure out how to configure Xdebug in PhpStorm properly.
PhpStorm is an IDE that can also help you with debugging. It launches the autofill function for hooks. In addition, there are many additional PhpStorm plugins to improve the PHP code, such as PHP Annotations, Drupal Symfony Bridge, etc. Don’t forget to enable Symfony integration before using PhpStorm.
#5. Drupal Error Log and Warnings Display
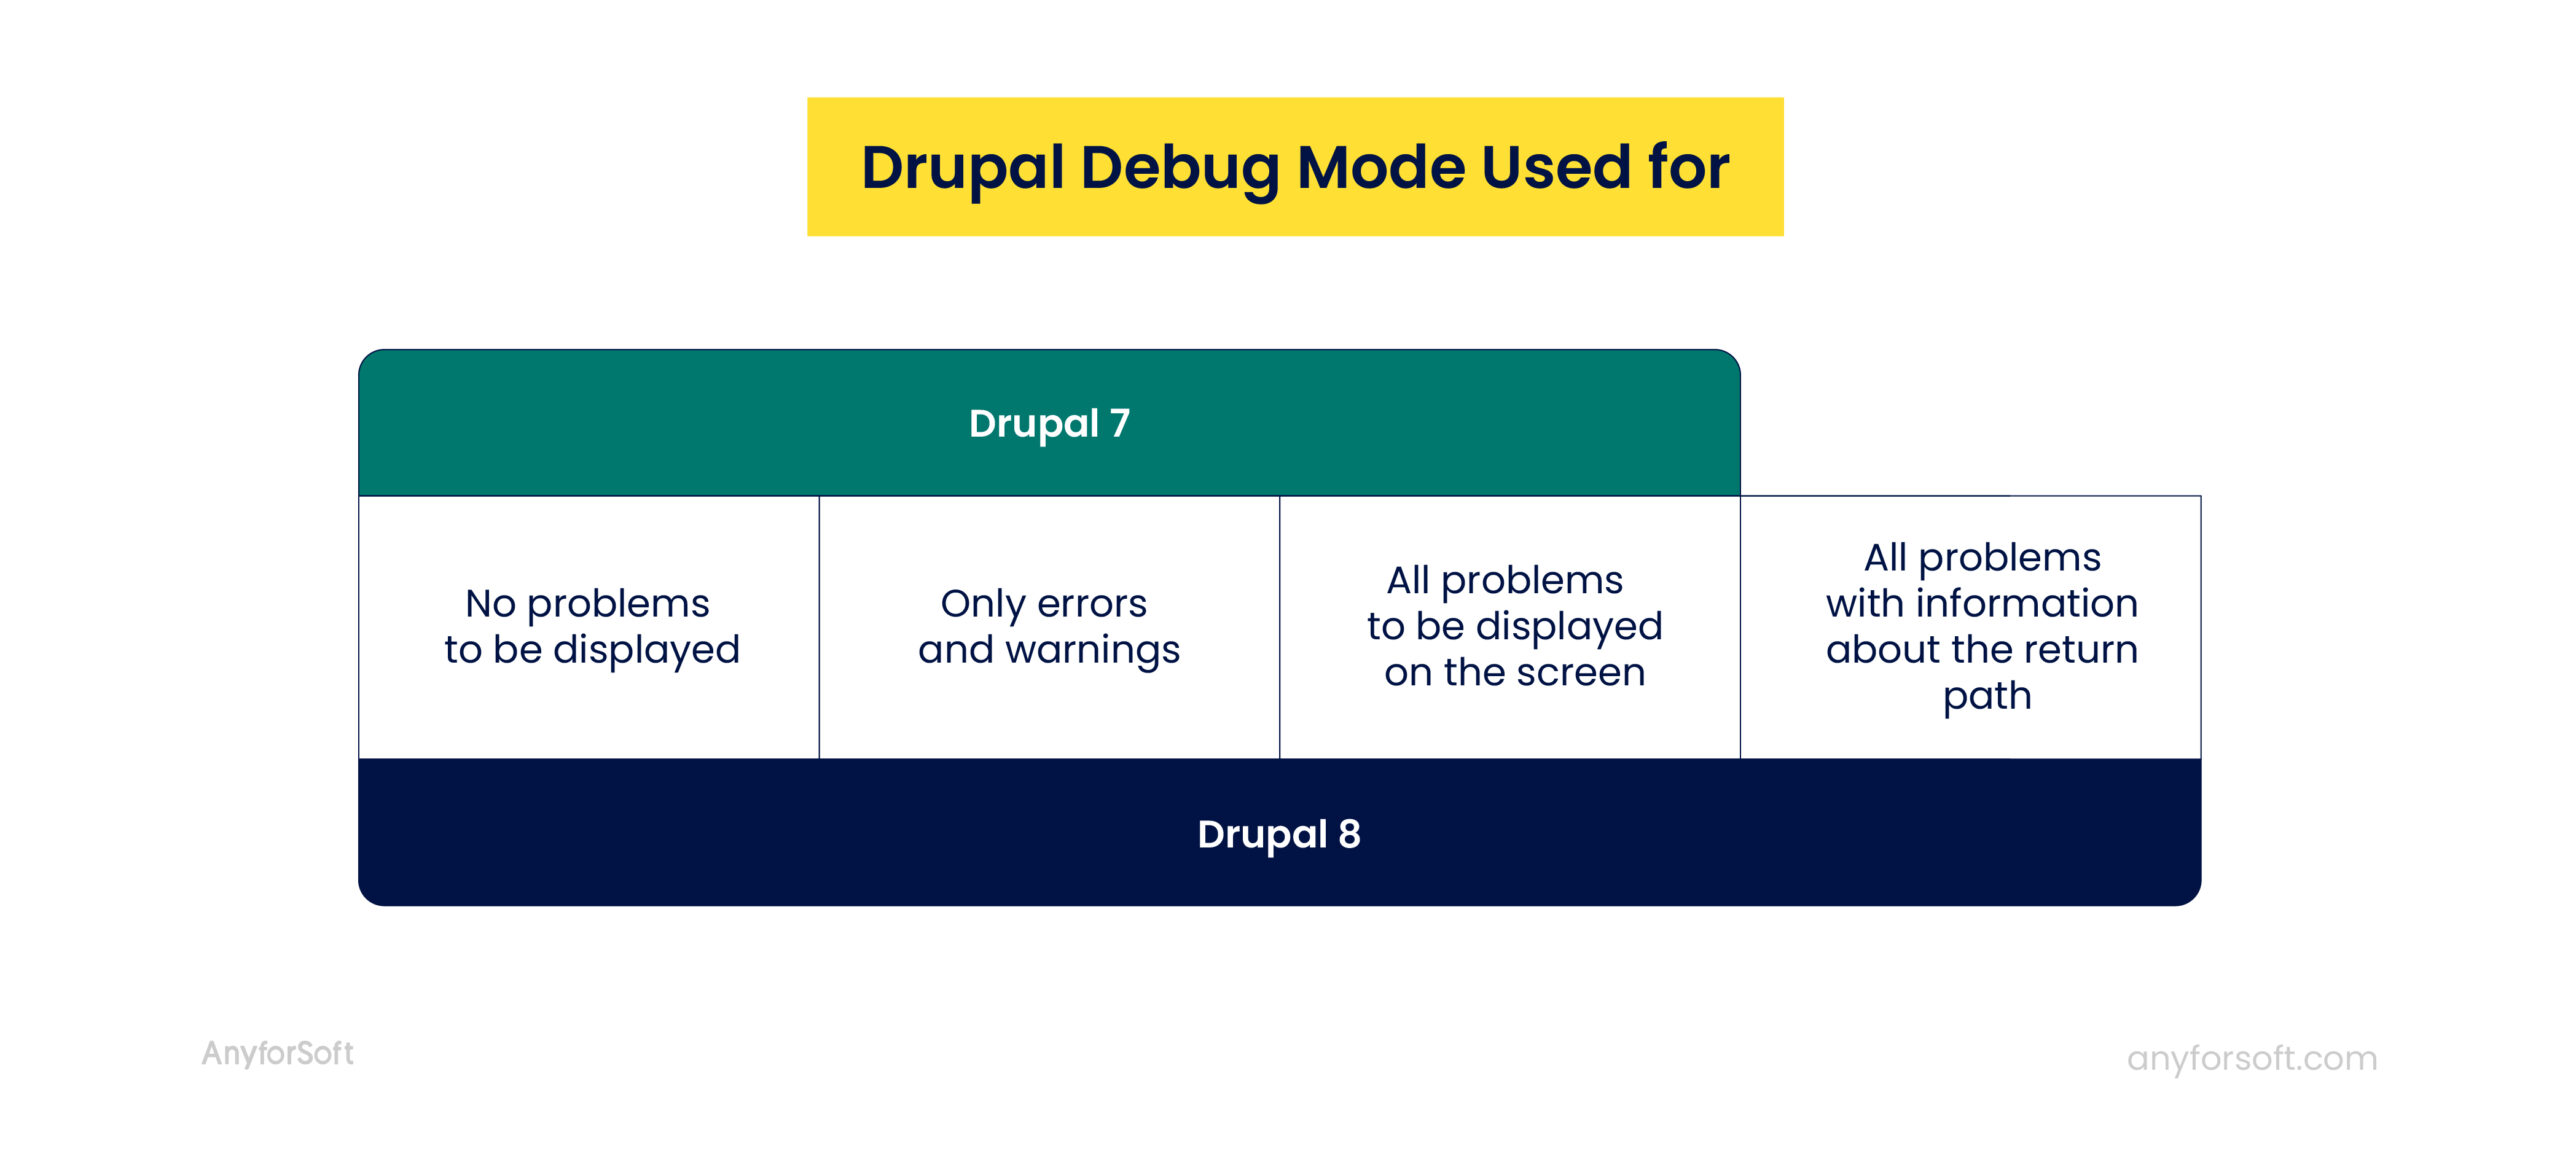
As you may remember, one of the features of Drupal 7 is that you can customize the list of issues on display. You can choose Drupal 8 debug mode for different options. Drupal performance logging is your powerful problem checker. Apply Drupal debug mode for fixing some problems with the information.
#6. Drupal 8 Logger
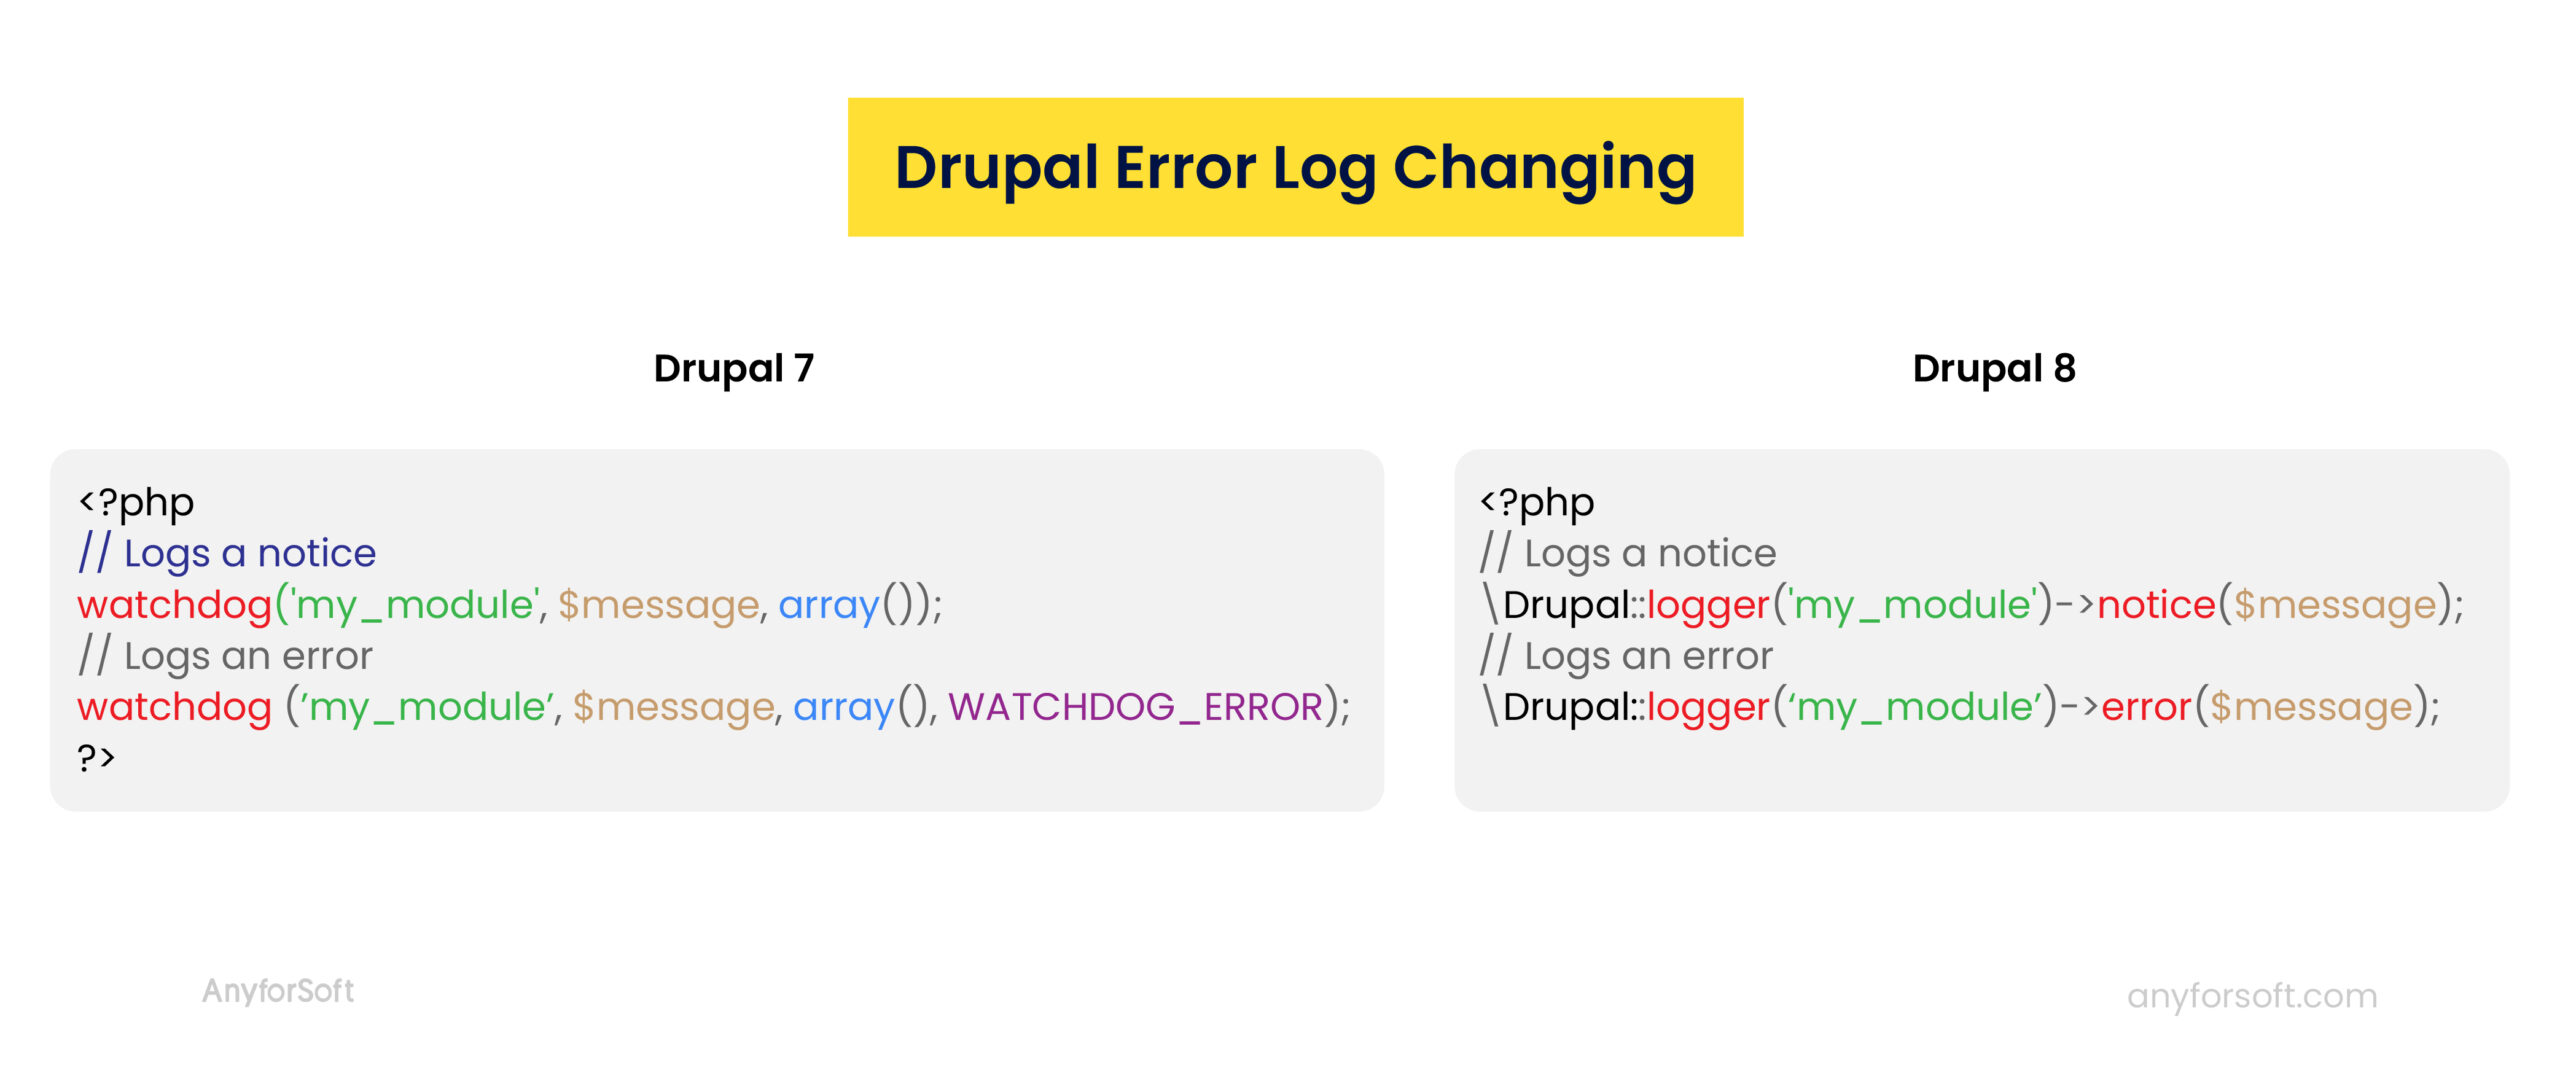
The introduction of Drupal error log was a significant difference between Drupal 7 and 8. With the database logging module, you can log messages to the code base. The watchdog() function is an integral part of the process. In Drupal 8, this module is also present. However, it is improved and is known as the Drupal 8 logger class. It creates a copy of the logger service and is helpful for debugging purposes.
What is the difference between logger in the 7th and 8th versions? We studied how the functionality has changed.

Final Thoughts
So how can you debug Drupal 8? Reference this list of easy-to-implement techniques to obtain the best results and create excellent Drupal debugging. Using suitable modules, it becomes easier to ensure that the frontend and backend web development is of the highest quality possible.
Xdebug and PHPStorm can be your best assistant tools during this process. Also, the Drupal development module, Drupal error log, Drupal 8 debug mode, and Web Profiler will be great ways to make the debugging process quick and more powerful for both sides. Now the way to debug the Drupal 8 website isn’t a problem.
However, it is important to entrust this challenging task to Drupal debug professionals who care and are fully focused on the result. At AnyforSoft, we enable debugging techniques that have proved their efficiency and can be used to successfully solve particular issues. For each Drupal site, we create an individual debugging roadmap. Feel free to contact our manager to discuss or estimate your project, we are open to collaboration!

